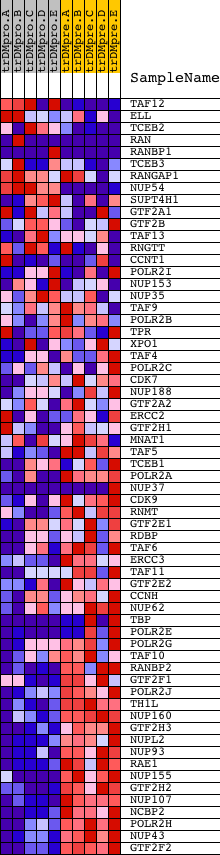
Profile of the Running ES Score & Positions of GeneSet Members on the Rank Ordered List
| Dataset | Set_04_transDMproB_versus_transDMpreB.phenotype_transDMproB_versus_transDMpreB.cls #transDMproB_versus_transDMpreB.phenotype_transDMproB_versus_transDMpreB.cls #transDMproB_versus_transDMpreB_repos |
| Phenotype | phenotype_transDMproB_versus_transDMpreB.cls#transDMproB_versus_transDMpreB_repos |
| Upregulated in class | transDMpreB |
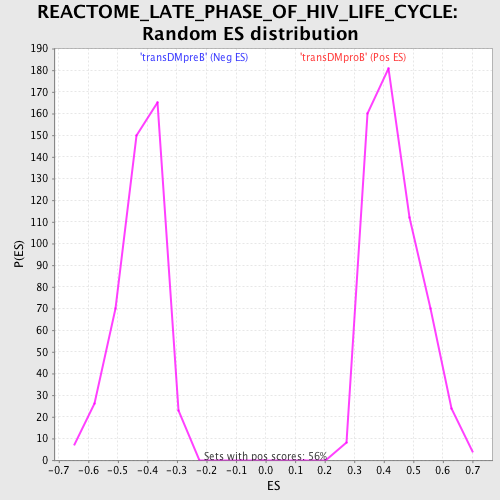
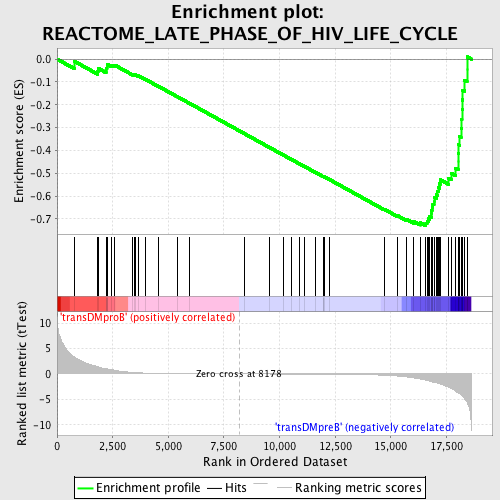
| GeneSet | REACTOME_LATE_PHASE_OF_HIV_LIFE_CYCLE |
| Enrichment Score (ES) | -0.730811 |
| Normalized Enrichment Score (NES) | -1.7151426 |
| Nominal p-value | 0.0 |
| FDR q-value | 0.004093892 |
| FWER p-Value | 0.058 |
| PROBE | DESCRIPTION (from dataset) | GENE SYMBOL | GENE_TITLE | RANK IN GENE LIST | RANK METRIC SCORE | RUNNING ES | CORE ENRICHMENT | |
|---|---|---|---|---|---|---|---|---|
| 1 | TAF12 | 2537 16058 2338 | 770 | 3.303 | -0.0091 | No | ||
| 2 | ELL | 18586 | 1828 | 1.381 | -0.0526 | No | ||
| 3 | TCEB2 | 12563 23102 7476 | 1843 | 1.361 | -0.0400 | No | ||
| 4 | RAN | 5356 9691 | 2201 | 1.000 | -0.0494 | No | ||
| 5 | RANBP1 | 9692 5357 | 2202 | 1.000 | -0.0396 | No | ||
| 6 | TCEB3 | 15707 | 2243 | 0.987 | -0.0321 | No | ||
| 7 | RANGAP1 | 2180 22195 | 2246 | 0.984 | -0.0226 | No | ||
| 8 | NUP54 | 11231 11232 6516 | 2456 | 0.810 | -0.0259 | No | ||
| 9 | SUPT4H1 | 9938 | 2592 | 0.705 | -0.0262 | No | ||
| 10 | GTF2A1 | 2064 8187 8188 13512 | 3399 | 0.290 | -0.0668 | No | ||
| 11 | GTF2B | 10489 | 3469 | 0.268 | -0.0679 | No | ||
| 12 | TAF13 | 8288 | 3504 | 0.259 | -0.0672 | No | ||
| 13 | RNGTT | 10769 2354 6272 | 3641 | 0.224 | -0.0724 | No | ||
| 14 | CCNT1 | 22140 11607 | 3966 | 0.159 | -0.0883 | No | ||
| 15 | POLR2I | 12839 | 4567 | 0.087 | -0.1198 | No | ||
| 16 | NUP153 | 21474 | 5412 | 0.049 | -0.1648 | No | ||
| 17 | NUP35 | 12803 | 5937 | 0.036 | -0.1927 | No | ||
| 18 | TAF9 | 3213 8433 | 8410 | -0.003 | -0.3259 | No | ||
| 19 | POLR2B | 16817 | 9561 | -0.017 | -0.3877 | No | ||
| 20 | TPR | 927 4255 | 10181 | -0.026 | -0.4208 | No | ||
| 21 | XPO1 | 4172 | 10543 | -0.031 | -0.4399 | No | ||
| 22 | TAF4 | 14319 | 10887 | -0.037 | -0.4581 | No | ||
| 23 | POLR2C | 9750 | 11135 | -0.042 | -0.4710 | No | ||
| 24 | CDK7 | 21365 | 11619 | -0.052 | -0.4965 | No | ||
| 25 | NUP188 | 15053 | 11986 | -0.060 | -0.5156 | No | ||
| 26 | GTF2A2 | 10654 | 11993 | -0.061 | -0.5154 | No | ||
| 27 | ERCC2 | 1549 18363 3812 | 12015 | -0.061 | -0.5159 | No | ||
| 28 | GTF2H1 | 4069 18236 | 12248 | -0.068 | -0.5277 | No | ||
| 29 | MNAT1 | 9396 2161 | 14706 | -0.256 | -0.6576 | No | ||
| 30 | TAF5 | 23833 5934 3759 | 15310 | -0.414 | -0.6861 | No | ||
| 31 | TCEB1 | 13995 | 15726 | -0.591 | -0.7027 | No | ||
| 32 | POLR2A | 5394 | 16021 | -0.780 | -0.7109 | No | ||
| 33 | NUP37 | 3294 3326 19909 | 16314 | -1.000 | -0.7168 | No | ||
| 34 | CDK9 | 14619 | 16575 | -1.224 | -0.7188 | Yes | ||
| 35 | RNMT | 7501 | 16629 | -1.276 | -0.7092 | Yes | ||
| 36 | GTF2E1 | 22597 | 16701 | -1.364 | -0.6996 | Yes | ||
| 37 | RDBP | 6589 | 16730 | -1.400 | -0.6874 | Yes | ||
| 38 | TAF6 | 16322 891 | 16824 | -1.518 | -0.6776 | Yes | ||
| 39 | ERCC3 | 23605 | 16832 | -1.531 | -0.6629 | Yes | ||
| 40 | TAF11 | 12733 | 16854 | -1.553 | -0.6488 | Yes | ||
| 41 | GTF2E2 | 18635 | 16888 | -1.589 | -0.6350 | Yes | ||
| 42 | CCNH | 7322 | 16942 | -1.644 | -0.6218 | Yes | ||
| 43 | NUP62 | 9497 | 16948 | -1.656 | -0.6058 | Yes | ||
| 44 | TBP | 671 1554 | 17049 | -1.751 | -0.5940 | Yes | ||
| 45 | POLR2E | 3325 19699 | 17108 | -1.814 | -0.5794 | Yes | ||
| 46 | POLR2G | 23753 | 17143 | -1.872 | -0.5629 | Yes | ||
| 47 | TAF10 | 10785 | 17191 | -1.953 | -0.5463 | Yes | ||
| 48 | RANBP2 | 20019 | 17218 | -1.991 | -0.5281 | Yes | ||
| 49 | GTF2F1 | 13599 | 17601 | -2.652 | -0.5227 | Yes | ||
| 50 | POLR2J | 16672 | 17714 | -2.890 | -0.5005 | Yes | ||
| 51 | TH1L | 14715 | 17900 | -3.349 | -0.4776 | Yes | ||
| 52 | NUP160 | 14957 | 18027 | -3.726 | -0.4479 | Yes | ||
| 53 | GTF2H3 | 5551 | 18028 | -3.729 | -0.4113 | Yes | ||
| 54 | NUPL2 | 6072 | 18049 | -3.784 | -0.3753 | Yes | ||
| 55 | NUP93 | 7762 | 18092 | -3.883 | -0.3395 | Yes | ||
| 56 | RAE1 | 12395 | 18159 | -4.157 | -0.3023 | Yes | ||
| 57 | NUP155 | 2298 5027 | 18189 | -4.257 | -0.2622 | Yes | ||
| 58 | GTF2H2 | 6236 | 18200 | -4.311 | -0.2205 | Yes | ||
| 59 | NUP107 | 8337 | 18212 | -4.349 | -0.1784 | Yes | ||
| 60 | NCBP2 | 12643 | 18234 | -4.445 | -0.1360 | Yes | ||
| 61 | POLR2H | 10888 | 18316 | -4.847 | -0.0928 | Yes | ||
| 62 | NUP43 | 20094 | 18428 | -5.554 | -0.0444 | Yes | ||
| 63 | GTF2F2 | 21750 | 18429 | -5.557 | 0.0101 | Yes |