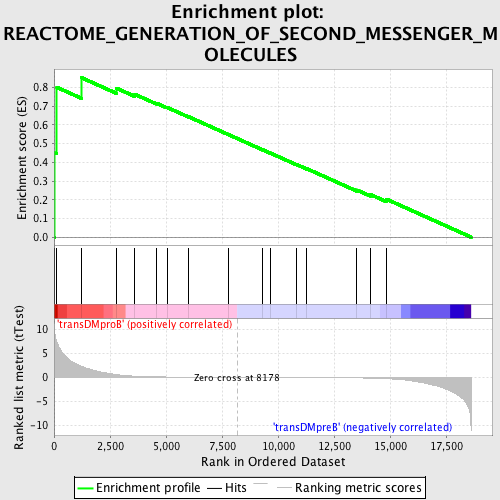
Profile of the Running ES Score & Positions of GeneSet Members on the Rank Ordered List
| Dataset | Set_04_transDMproB_versus_transDMpreB.phenotype_transDMproB_versus_transDMpreB.cls #transDMproB_versus_transDMpreB.phenotype_transDMproB_versus_transDMpreB.cls #transDMproB_versus_transDMpreB_repos |
| Phenotype | phenotype_transDMproB_versus_transDMpreB.cls#transDMproB_versus_transDMpreB_repos |
| Upregulated in class | transDMproB |
| GeneSet | REACTOME_GENERATION_OF_SECOND_MESSENGER_MOLECULES |
| Enrichment Score (ES) | 0.85325414 |
| Normalized Enrichment Score (NES) | 1.5273544 |
| Nominal p-value | 0.007751938 |
| FDR q-value | 0.39687428 |
| FWER p-Value | 0.971 |
| PROBE | DESCRIPTION (from dataset) | GENE SYMBOL | GENE_TITLE | RANK IN GENE LIST | RANK METRIC SCORE | RUNNING ES | CORE ENRICHMENT | |
|---|---|---|---|---|---|---|---|---|
| 1 | LCK | 15746 | 27 | 9.283 | 0.4503 | Yes | ||
| 2 | LAT | 17643 | 124 | 7.317 | 0.8012 | Yes | ||
| 3 | WAS | 24193 | 1213 | 2.272 | 0.8533 | Yes | ||
| 4 | PAK1 | 9527 | 2776 | 0.568 | 0.7969 | No | ||
| 5 | CD3D | 19473 | 3602 | 0.234 | 0.7640 | No | ||
| 6 | FYB | 10717 | 4573 | 0.087 | 0.7161 | No | ||
| 7 | GRAP2 | 5113 9398 | 5041 | 0.061 | 0.6939 | No | ||
| 8 | CD3G | 19139 | 6008 | 0.034 | 0.6437 | No | ||
| 9 | CD3E | 8714 | 7771 | 0.006 | 0.5492 | No | ||
| 10 | ITK | 4934 | 9323 | -0.014 | 0.4665 | No | ||
| 11 | CD4 | 16999 | 9643 | -0.018 | 0.4503 | No | ||
| 12 | PLCG1 | 14753 | 10828 | -0.036 | 0.3884 | No | ||
| 13 | NCK1 | 9447 5152 | 11287 | -0.044 | 0.3659 | No | ||
| 14 | ZAP70 | 14271 4042 | 13513 | -0.123 | 0.2523 | No | ||
| 15 | ENAH | 4665 8901 | 14118 | -0.175 | 0.2283 | No | ||
| 16 | LCP2 | 4988 9268 | 14824 | -0.276 | 0.2039 | No |

