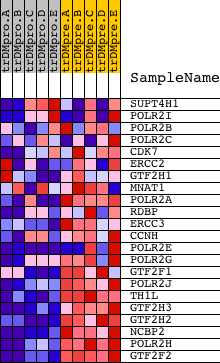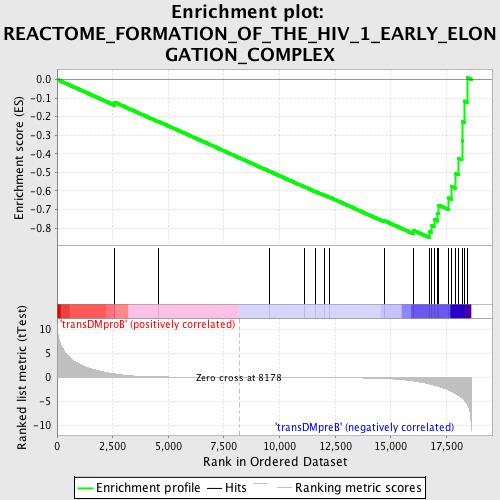
Profile of the Running ES Score & Positions of GeneSet Members on the Rank Ordered List
| Dataset | Set_04_transDMproB_versus_transDMpreB.phenotype_transDMproB_versus_transDMpreB.cls #transDMproB_versus_transDMpreB.phenotype_transDMproB_versus_transDMpreB.cls #transDMproB_versus_transDMpreB_repos |
| Phenotype | phenotype_transDMproB_versus_transDMpreB.cls#transDMproB_versus_transDMpreB_repos |
| Upregulated in class | transDMpreB |
| GeneSet | REACTOME_FORMATION_OF_THE_HIV_1_EARLY_ELONGATION_COMPLEX |
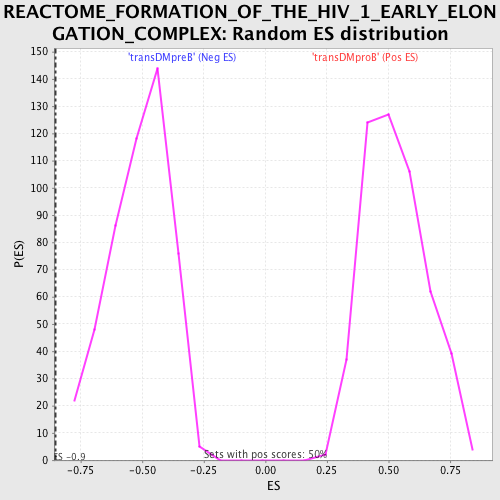
| Enrichment Score (ES) | -0.85010815 |
| Normalized Enrichment Score (NES) | -1.665963 |
| Nominal p-value | 0.0 |
| FDR q-value | 0.01230119 |
| FWER p-Value | 0.195 |
| PROBE | DESCRIPTION (from dataset) | GENE SYMBOL | GENE_TITLE | RANK IN GENE LIST | RANK METRIC SCORE | RUNNING ES | CORE ENRICHMENT | |
|---|---|---|---|---|---|---|---|---|
| 1 | SUPT4H1 | 9938 | 2592 | 0.705 | -0.1226 | No | ||
| 2 | POLR2I | 12839 | 4567 | 0.087 | -0.2267 | No | ||
| 3 | POLR2B | 16817 | 9561 | -0.017 | -0.4948 | No | ||
| 4 | POLR2C | 9750 | 11135 | -0.042 | -0.5784 | No | ||
| 5 | CDK7 | 21365 | 11619 | -0.052 | -0.6032 | No | ||
| 6 | ERCC2 | 1549 18363 3812 | 12015 | -0.061 | -0.6230 | No | ||
| 7 | GTF2H1 | 4069 18236 | 12248 | -0.068 | -0.6338 | No | ||
| 8 | MNAT1 | 9396 2161 | 14706 | -0.256 | -0.7599 | No | ||
| 9 | POLR2A | 5394 | 16021 | -0.780 | -0.8120 | No | ||
| 10 | RDBP | 6589 | 16730 | -1.400 | -0.8169 | Yes | ||
| 11 | ERCC3 | 23605 | 16832 | -1.531 | -0.7859 | Yes | ||
| 12 | CCNH | 7322 | 16942 | -1.644 | -0.7528 | Yes | ||
| 13 | POLR2E | 3325 19699 | 17108 | -1.814 | -0.7185 | Yes | ||
| 14 | POLR2G | 23753 | 17143 | -1.872 | -0.6759 | Yes | ||
| 15 | GTF2F1 | 13599 | 17601 | -2.652 | -0.6375 | Yes | ||
| 16 | POLR2J | 16672 | 17714 | -2.890 | -0.5749 | Yes | ||
| 17 | TH1L | 14715 | 17900 | -3.349 | -0.5053 | Yes | ||
| 18 | GTF2H3 | 5551 | 18028 | -3.729 | -0.4236 | Yes | ||
| 19 | GTF2H2 | 6236 | 18200 | -4.311 | -0.3304 | Yes | ||
| 20 | NCBP2 | 12643 | 18234 | -4.445 | -0.2266 | Yes | ||
| 21 | POLR2H | 10888 | 18316 | -4.847 | -0.1159 | Yes | ||
| 22 | GTF2F2 | 21750 | 18429 | -5.557 | 0.0101 | Yes |