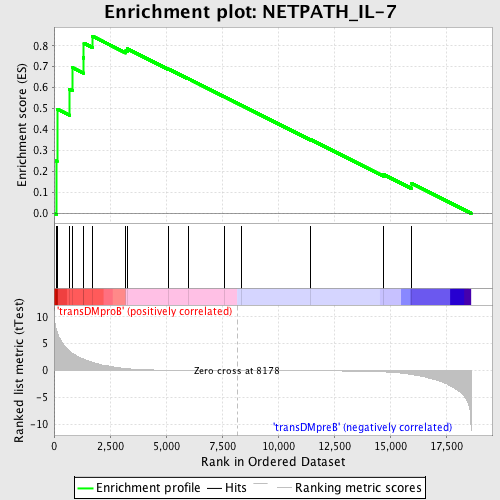
Profile of the Running ES Score & Positions of GeneSet Members on the Rank Ordered List
| Dataset | Set_04_transDMproB_versus_transDMpreB.phenotype_transDMproB_versus_transDMpreB.cls #transDMproB_versus_transDMpreB.phenotype_transDMproB_versus_transDMpreB.cls #transDMproB_versus_transDMpreB_repos |
| Phenotype | phenotype_transDMproB_versus_transDMpreB.cls#transDMproB_versus_transDMpreB_repos |
| Upregulated in class | transDMproB |
| GeneSet | NETPATH_IL-7 |
| Enrichment Score (ES) | 0.84603536 |
| Normalized Enrichment Score (NES) | 1.5334367 |
| Nominal p-value | 0.018108651 |
| FDR q-value | 0.3997452 |
| FWER p-Value | 0.957 |
| PROBE | DESCRIPTION (from dataset) | GENE SYMBOL | GENE_TITLE | RANK IN GENE LIST | RANK METRIC SCORE | RUNNING ES | CORE ENRICHMENT | |
|---|---|---|---|---|---|---|---|---|
| 1 | IL7R | 9175 4922 | 113 | 7.459 | 0.2499 | Yes | ||
| 2 | JAK3 | 9198 4936 | 133 | 7.251 | 0.4978 | Yes | ||
| 3 | STAT3 | 5525 9906 | 681 | 3.642 | 0.5933 | Yes | ||
| 4 | STAT5A | 20664 | 824 | 3.180 | 0.6949 | Yes | ||
| 5 | MCL1 | 15502 | 1299 | 2.143 | 0.7429 | Yes | ||
| 6 | JAK1 | 15827 | 1333 | 2.074 | 0.8123 | Yes | ||
| 7 | PTK2B | 21776 | 1704 | 1.562 | 0.8460 | Yes | ||
| 8 | FYN | 3375 3395 20052 | 3206 | 0.359 | 0.7777 | No | ||
| 9 | IL7 | 4921 | 3269 | 0.334 | 0.7858 | No | ||
| 10 | PIK3R1 | 3170 | 5108 | 0.059 | 0.6890 | No | ||
| 11 | STAT5B | 20222 | 5983 | 0.035 | 0.6432 | No | ||
| 12 | LYN | 16281 | 7605 | 0.008 | 0.5564 | No | ||
| 13 | IRS1 | 4925 | 8350 | -0.002 | 0.5164 | No | ||
| 14 | INSL3 | 9181 | 11461 | -0.048 | 0.3509 | No | ||
| 15 | IL2RG | 24096 | 14693 | -0.254 | 0.1859 | No | ||
| 16 | BCL2L11 | 2790 14861 | 15947 | -0.727 | 0.1435 | No |

