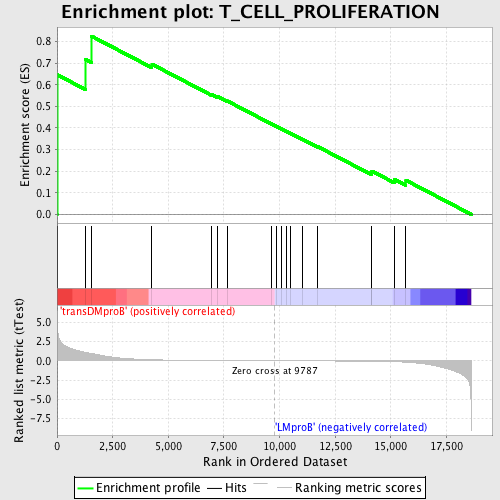
Profile of the Running ES Score & Positions of GeneSet Members on the Rank Ordered List
| Dataset | Set_04_transDMproB_versus_LMproB.phenotype_transDMproB_versus_LMproB.cls #transDMproB_versus_LMproB |
| Phenotype | phenotype_transDMproB_versus_LMproB.cls#transDMproB_versus_LMproB |
| Upregulated in class | transDMproB |
| GeneSet | T_CELL_PROLIFERATION |
| Enrichment Score (ES) | 0.82514596 |
| Normalized Enrichment Score (NES) | 1.5766207 |
| Nominal p-value | 0.005504587 |
| FDR q-value | 0.20421334 |
| FWER p-Value | 0.896 |
| PROBE | DESCRIPTION (from dataset) | GENE SYMBOL | GENE_TITLE | RANK IN GENE LIST | RANK METRIC SCORE | RUNNING ES | CORE ENRICHMENT | |
|---|---|---|---|---|---|---|---|---|
| 1 | EBI3 | 23193 | 4 | 5.032 | 0.6463 | Yes | ||
| 2 | CD24 | 8711 | 1276 | 1.086 | 0.7174 | Yes | ||
| 3 | NCK2 | 9448 | 1541 | 0.949 | 0.8251 | Yes | ||
| 4 | ELF4 | 24162 | 4264 | 0.127 | 0.6951 | No | ||
| 5 | IL27 | 17636 | 6956 | 0.035 | 0.5549 | No | ||
| 6 | ICOSLG | 19973 | 7194 | 0.031 | 0.5462 | No | ||
| 7 | IL12B | 20918 | 7647 | 0.025 | 0.5251 | No | ||
| 8 | CD28 | 14239 4092 | 9636 | 0.002 | 0.4184 | No | ||
| 9 | GLMN | 16452 3562 | 9854 | -0.001 | 0.4069 | No | ||
| 10 | CD3E | 8714 | 10063 | -0.003 | 0.3961 | No | ||
| 11 | NCK1 | 9447 5152 | 10316 | -0.006 | 0.3833 | No | ||
| 12 | IL21 | 12241 | 10512 | -0.008 | 0.3738 | No | ||
| 13 | IL4 | 9174 | 11022 | -0.013 | 0.3482 | No | ||
| 14 | SFTPD | 21867 | 11712 | -0.022 | 0.3139 | No | ||
| 15 | IL18 | 9172 | 14126 | -0.068 | 0.1929 | No | ||
| 16 | CRTAM | 19160 | 14145 | -0.068 | 0.2007 | No | ||
| 17 | PTPRC | 5327 9662 | 15157 | -0.123 | 0.1621 | No | ||
| 18 | CADM1 | 7057 | 15679 | -0.185 | 0.1579 | No |

