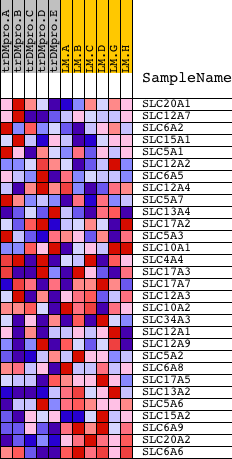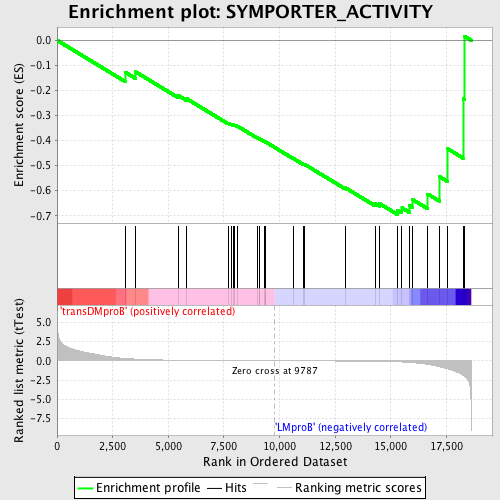
Profile of the Running ES Score & Positions of GeneSet Members on the Rank Ordered List
| Dataset | Set_04_transDMproB_versus_LMproB.phenotype_transDMproB_versus_LMproB.cls #transDMproB_versus_LMproB |
| Phenotype | phenotype_transDMproB_versus_LMproB.cls#transDMproB_versus_LMproB |
| Upregulated in class | LMproB |
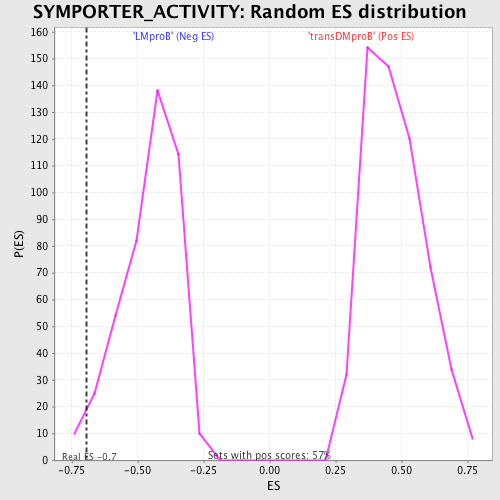
| GeneSet | SYMPORTER_ACTIVITY |
| Enrichment Score (ES) | -0.69483703 |
| Normalized Enrichment Score (NES) | -1.524146 |
| Nominal p-value | 0.025404157 |
| FDR q-value | 0.60914093 |
| FWER p-Value | 0.999 |
| PROBE | DESCRIPTION (from dataset) | GENE SYMBOL | GENE_TITLE | RANK IN GENE LIST | RANK METRIC SCORE | RUNNING ES | CORE ENRICHMENT | |
|---|---|---|---|---|---|---|---|---|
| 1 | SLC20A1 | 14855 | 3055 | 0.298 | -0.1269 | No | ||
| 2 | SLC12A7 | 21603 | 3523 | 0.211 | -0.1256 | No | ||
| 3 | SLC6A2 | 3864 3924 3902 | 5447 | 0.069 | -0.2203 | No | ||
| 4 | SLC15A1 | 12156 | 5806 | 0.059 | -0.2321 | No | ||
| 5 | SLC5A1 | 5455 | 7684 | 0.024 | -0.3301 | No | ||
| 6 | SLC12A2 | 23547 2026 | 7829 | 0.022 | -0.3350 | No | ||
| 7 | SLC6A5 | 18230 | 7905 | 0.021 | -0.3364 | No | ||
| 8 | SLC12A4 | 18763 | 7992 | 0.020 | -0.3386 | No | ||
| 9 | SLC5A7 | 22938 | 8122 | 0.018 | -0.3433 | No | ||
| 10 | SLC13A4 | 17185 | 8989 | 0.009 | -0.3888 | No | ||
| 11 | SLC17A2 | 10163 5744 | 9089 | 0.008 | -0.3931 | No | ||
| 12 | SLC5A3 | 11999 | 9096 | 0.008 | -0.3925 | No | ||
| 13 | SLC10A1 | 5450 | 9324 | 0.005 | -0.4041 | No | ||
| 14 | SLC4A4 | 16807 12035 7036 | 9361 | 0.005 | -0.4054 | No | ||
| 15 | SLC17A3 | 3165 21694 | 9375 | 0.005 | -0.4056 | No | ||
| 16 | SLC17A7 | 13081 | 10621 | -0.009 | -0.4714 | No | ||
| 17 | SLC12A3 | 3799 5451 | 11089 | -0.014 | -0.4948 | No | ||
| 18 | SLC10A2 | 18939 | 11138 | -0.015 | -0.4955 | No | ||
| 19 | SLC34A3 | 14664 | 12954 | -0.040 | -0.5882 | No | ||
| 20 | SLC12A1 | 14874 2772 2943 | 14300 | -0.074 | -0.6513 | No | ||
| 21 | SLC12A9 | 16332 3654 | 14489 | -0.081 | -0.6512 | No | ||
| 22 | SLC5A2 | 18057 10905 | 15302 | -0.137 | -0.6777 | Yes | ||
| 23 | SLC6A8 | 24306 | 15501 | -0.158 | -0.6685 | Yes | ||
| 24 | SLC17A5 | 19055 | 15844 | -0.218 | -0.6595 | Yes | ||
| 25 | SLC13A2 | 20336 | 15989 | -0.250 | -0.6359 | Yes | ||
| 26 | SLC5A6 | 16575 | 16659 | -0.467 | -0.6132 | Yes | ||
| 27 | SLC15A2 | 22600 | 17194 | -0.778 | -0.5442 | Yes | ||
| 28 | SLC6A9 | 4783 | 17560 | -1.042 | -0.4330 | Yes | ||
| 29 | SLC20A2 | 18654 | 18249 | -1.893 | -0.2322 | Yes | ||
| 30 | SLC6A6 | 17354 | 18304 | -2.005 | 0.0168 | Yes |