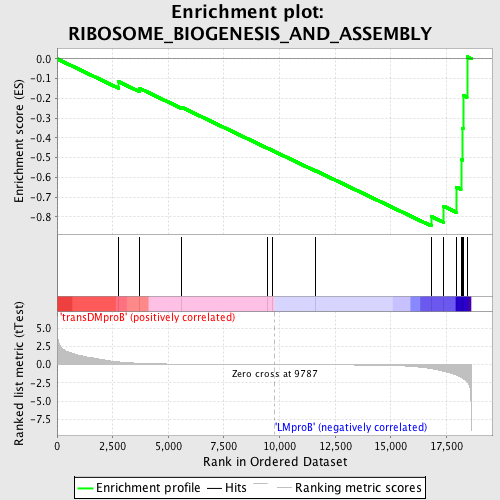
Profile of the Running ES Score & Positions of GeneSet Members on the Rank Ordered List
| Dataset | Set_04_transDMproB_versus_LMproB.phenotype_transDMproB_versus_LMproB.cls #transDMproB_versus_LMproB |
| Phenotype | phenotype_transDMproB_versus_LMproB.cls#transDMproB_versus_LMproB |
| Upregulated in class | LMproB |
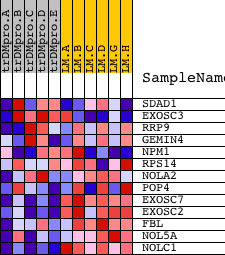
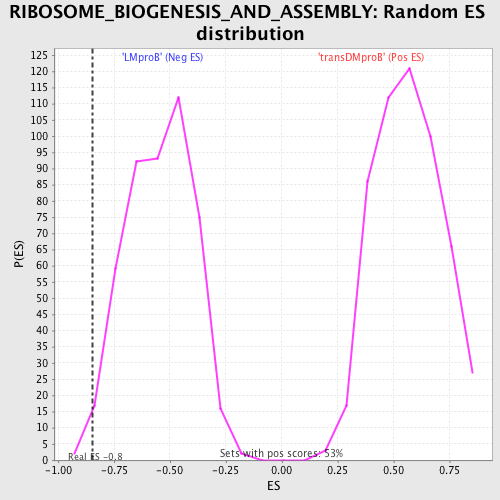
| GeneSet | RIBOSOME_BIOGENESIS_AND_ASSEMBLY |
| Enrichment Score (ES) | -0.84585965 |
| Normalized Enrichment Score (NES) | -1.5525357 |
| Nominal p-value | 0.010683761 |
| FDR q-value | 0.69034183 |
| FWER p-Value | 0.994 |
| PROBE | DESCRIPTION (from dataset) | GENE SYMBOL | GENE_TITLE | RANK IN GENE LIST | RANK METRIC SCORE | RUNNING ES | CORE ENRICHMENT | |
|---|---|---|---|---|---|---|---|---|
| 1 | SDAD1 | 16479 | 2770 | 0.372 | -0.1158 | No | ||
| 2 | EXOSC3 | 15890 | 3691 | 0.188 | -0.1485 | No | ||
| 3 | RRP9 | 19328 | 5575 | 0.066 | -0.2439 | No | ||
| 4 | GEMIN4 | 6592 6591 | 9468 | 0.003 | -0.4528 | No | ||
| 5 | NPM1 | 1196 | 9669 | 0.001 | -0.4634 | No | ||
| 6 | RPS14 | 9751 | 11618 | -0.020 | -0.5663 | No | ||
| 7 | NOLA2 | 11972 | 16820 | -0.543 | -0.7975 | Yes | ||
| 8 | POP4 | 7261 | 17366 | -0.916 | -0.7454 | Yes | ||
| 9 | EXOSC7 | 19256 | 17939 | -1.431 | -0.6489 | Yes | ||
| 10 | EXOSC2 | 15044 | 18155 | -1.702 | -0.5091 | Yes | ||
| 11 | FBL | 8955 | 18214 | -1.809 | -0.3513 | Yes | ||
| 12 | NOL5A | 12474 | 18250 | -1.893 | -0.1848 | Yes | ||
| 13 | NOLC1 | 7704 | 18425 | -2.298 | 0.0103 | Yes |