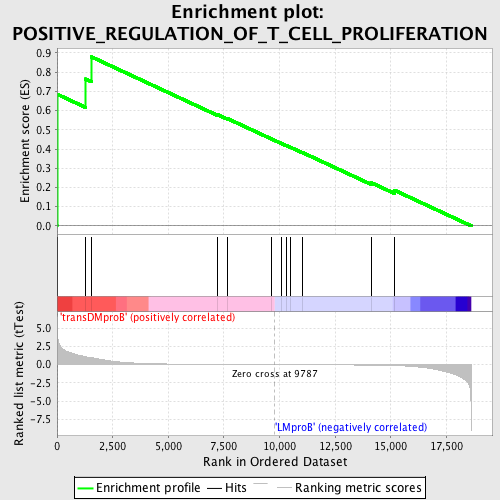
Profile of the Running ES Score & Positions of GeneSet Members on the Rank Ordered List
| Dataset | Set_04_transDMproB_versus_LMproB.phenotype_transDMproB_versus_LMproB.cls #transDMproB_versus_LMproB |
| Phenotype | phenotype_transDMproB_versus_LMproB.cls#transDMproB_versus_LMproB |
| Upregulated in class | transDMproB |
| GeneSet | POSITIVE_REGULATION_OF_T_CELL_PROLIFERATION |
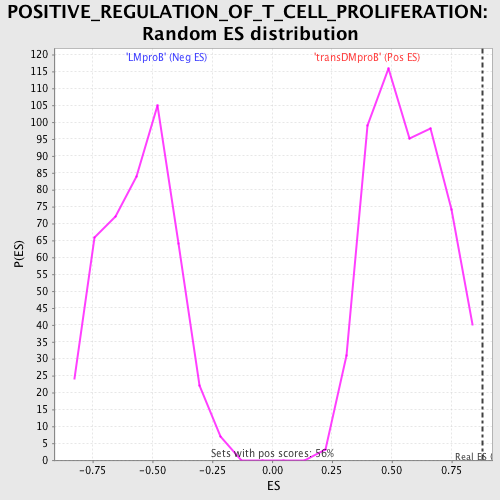
| Enrichment Score (ES) | 0.87933904 |
| Normalized Enrichment Score (NES) | 1.5584341 |
| Nominal p-value | 0.0017985612 |
| FDR q-value | 0.26319987 |
| FWER p-Value | 0.956 |
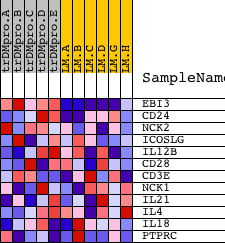
| PROBE | DESCRIPTION (from dataset) | GENE SYMBOL | GENE_TITLE | RANK IN GENE LIST | RANK METRIC SCORE | RUNNING ES | CORE ENRICHMENT | |
|---|---|---|---|---|---|---|---|---|
| 1 | EBI3 | 23193 | 4 | 5.032 | 0.6849 | Yes | ||
| 2 | CD24 | 8711 | 1276 | 1.086 | 0.7644 | Yes | ||
| 3 | NCK2 | 9448 | 1541 | 0.949 | 0.8793 | Yes | ||
| 4 | ICOSLG | 19973 | 7194 | 0.031 | 0.5798 | No | ||
| 5 | IL12B | 20918 | 7647 | 0.025 | 0.5589 | No | ||
| 6 | CD28 | 14239 4092 | 9636 | 0.002 | 0.4523 | No | ||
| 7 | CD3E | 8714 | 10063 | -0.003 | 0.4298 | No | ||
| 8 | NCK1 | 9447 5152 | 10316 | -0.006 | 0.4171 | No | ||
| 9 | IL21 | 12241 | 10512 | -0.008 | 0.4077 | No | ||
| 10 | IL4 | 9174 | 11022 | -0.013 | 0.3821 | No | ||
| 11 | IL18 | 9172 | 14126 | -0.068 | 0.2245 | No | ||
| 12 | PTPRC | 5327 9662 | 15157 | -0.123 | 0.1859 | No |