Profile of the Running ES Score & Positions of GeneSet Members on the Rank Ordered List
| Dataset | Set_04_transDMproB_versus_LMproB.phenotype_transDMproB_versus_LMproB.cls #transDMproB_versus_LMproB |
| Phenotype | phenotype_transDMproB_versus_LMproB.cls#transDMproB_versus_LMproB |
| Upregulated in class | transDMproB |
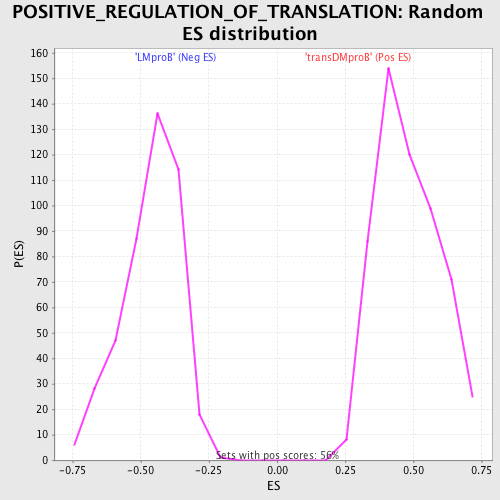
| GeneSet | POSITIVE_REGULATION_OF_TRANSLATION |
| Enrichment Score (ES) | 0.818864 |
| Normalized Enrichment Score (NES) | 1.7040985 |
| Nominal p-value | 0.0 |
| FDR q-value | 0.06082401 |
| FWER p-Value | 0.111 |
| PROBE | DESCRIPTION (from dataset) | GENE SYMBOL | GENE_TITLE | RANK IN GENE LIST | RANK METRIC SCORE | RUNNING ES | CORE ENRICHMENT | |
|---|---|---|---|---|---|---|---|---|
| 1 | EBI3 | 23193 | 4 | 5.032 | 0.2043 | Yes | ||
| 2 | LTB | 23259 | 7 | 4.957 | 0.4057 | Yes | ||
| 3 | IRF4 | 21679 | 57 | 3.107 | 0.5294 | Yes | ||
| 4 | PRG3 | 14971 | 65 | 3.022 | 0.6519 | Yes | ||
| 5 | BCL10 | 15397 | 87 | 2.804 | 0.7647 | Yes | ||
| 6 | BCL3 | 8654 | 438 | 1.795 | 0.8189 | Yes | ||
| 7 | SPN | 452 5493 | 1982 | 0.698 | 0.7642 | No | ||
| 8 | APOA2 | 8615 4044 | 2787 | 0.366 | 0.7358 | No | ||
| 9 | TLR6 | 215 16528 | 3247 | 0.258 | 0.7216 | No | ||
| 10 | EREG | 4679 16797 | 4331 | 0.121 | 0.6683 | No | ||
| 11 | TLR3 | 18884 | 5413 | 0.071 | 0.6130 | No | ||
| 12 | TLR8 | 9308 | 6113 | 0.051 | 0.5775 | No | ||
| 13 | BOLL | 7960 | 6150 | 0.050 | 0.5776 | No | ||
| 14 | IL27 | 17636 | 6956 | 0.035 | 0.5357 | No | ||
| 15 | TLR9 | 19331 3127 | 6978 | 0.035 | 0.5360 | No | ||
| 16 | ELA2 | 11925 8893 | 7414 | 0.028 | 0.5137 | No | ||
| 17 | IL12B | 20918 | 7647 | 0.025 | 0.5022 | No | ||
| 18 | IL9 | 21444 | 7661 | 0.024 | 0.5025 | No | ||
| 19 | TNFRSF8 | 2373 5784 | 7816 | 0.022 | 0.4951 | No | ||
| 20 | SAMD4A | 13211 | 8294 | 0.016 | 0.4701 | No | ||
| 21 | CD28 | 14239 4092 | 9636 | 0.002 | 0.3981 | No | ||
| 22 | GLMN | 16452 3562 | 9854 | -0.001 | 0.3864 | No | ||
| 23 | DAZL | 22944 | 10313 | -0.006 | 0.3620 | No | ||
| 24 | TLR4 | 2329 10191 5770 | 10696 | -0.010 | 0.3419 | No | ||
| 25 | IL4 | 9174 | 11022 | -0.013 | 0.3249 | No | ||
| 26 | TLR1 | 10190 | 11462 | -0.018 | 0.3020 | No | ||
| 27 | IL6 | 16895 | 14254 | -0.072 | 0.1548 | No | ||
| 28 | TLR7 | 24004 | 15074 | -0.117 | 0.1155 | No | ||
| 29 | EIF2B5 | 1719 22822 | 15163 | -0.123 | 0.1158 | No | ||
| 30 | EIF5A | 11345 20379 6590 | 18169 | -1.721 | 0.0240 | No |