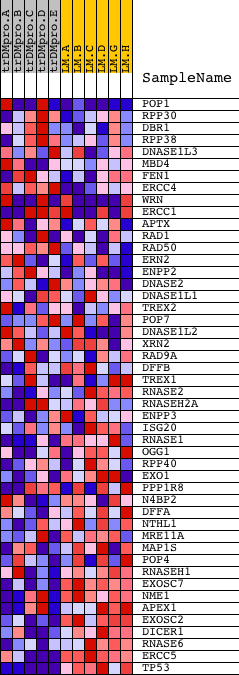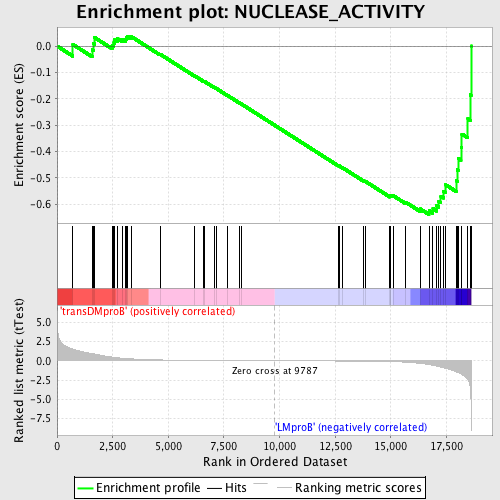
Profile of the Running ES Score & Positions of GeneSet Members on the Rank Ordered List
| Dataset | Set_04_transDMproB_versus_LMproB.phenotype_transDMproB_versus_LMproB.cls #transDMproB_versus_LMproB |
| Phenotype | phenotype_transDMproB_versus_LMproB.cls#transDMproB_versus_LMproB |
| Upregulated in class | LMproB |
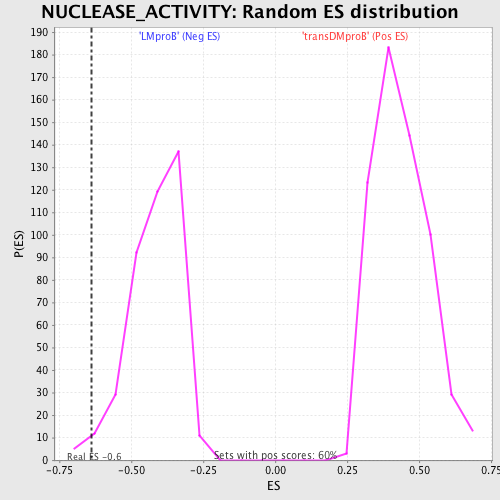
| GeneSet | NUCLEASE_ACTIVITY |
| Enrichment Score (ES) | -0.63847387 |
| Normalized Enrichment Score (NES) | -1.5316509 |
| Nominal p-value | 0.01728395 |
| FDR q-value | 0.59912616 |
| FWER p-Value | 0.999 |
| PROBE | DESCRIPTION (from dataset) | GENE SYMBOL | GENE_TITLE | RANK IN GENE LIST | RANK METRIC SCORE | RUNNING ES | CORE ENRICHMENT | |
|---|---|---|---|---|---|---|---|---|
| 1 | POP1 | 2214 7482 | 710 | 1.522 | 0.0060 | No | ||
| 2 | RPP30 | 23877 | 1577 | 0.932 | -0.0135 | No | ||
| 3 | DBR1 | 19341 | 1635 | 0.897 | 0.0095 | No | ||
| 4 | RPP38 | 14698 | 1681 | 0.874 | 0.0325 | No | ||
| 5 | DNASE1L3 | 21925 | 2474 | 0.480 | 0.0038 | No | ||
| 6 | MBD4 | 17033 | 2554 | 0.447 | 0.0126 | No | ||
| 7 | FEN1 | 8961 | 2585 | 0.433 | 0.0235 | No | ||
| 8 | ERCC4 | 6927 11921 | 2702 | 0.393 | 0.0287 | No | ||
| 9 | WRN | 5882 10315 | 2942 | 0.324 | 0.0253 | No | ||
| 10 | ERCC1 | 1235 1045 1646 | 3093 | 0.287 | 0.0256 | No | ||
| 11 | APTX | 2455 7291 | 3114 | 0.283 | 0.0327 | No | ||
| 12 | RAD1 | 22507 | 3168 | 0.273 | 0.0378 | No | ||
| 13 | RAD50 | 1198 20460 | 3326 | 0.242 | 0.0364 | No | ||
| 14 | ERN2 | 17651 | 4626 | 0.104 | -0.0305 | No | ||
| 15 | ENPP2 | 9548 | 6196 | 0.049 | -0.1136 | No | ||
| 16 | DNASE2 | 8855 | 6590 | 0.042 | -0.1336 | No | ||
| 17 | DNASE1L1 | 24128 | 6627 | 0.041 | -0.1343 | No | ||
| 18 | TREX2 | 24137 | 7071 | 0.033 | -0.1572 | No | ||
| 19 | POP7 | 16329 | 7166 | 0.032 | -0.1613 | No | ||
| 20 | DNASE1L2 | 960 23092 | 7668 | 0.024 | -0.1876 | No | ||
| 21 | XRN2 | 2936 6302 2905 | 8194 | 0.017 | -0.2154 | No | ||
| 22 | RAD9A | 913 3674 910 23958 | 8309 | 0.016 | -0.2210 | No | ||
| 23 | DFFB | 15654 | 12636 | -0.034 | -0.4530 | No | ||
| 24 | TREX1 | 10219 3111 | 12675 | -0.035 | -0.4540 | No | ||
| 25 | RNASE2 | 16758 | 12845 | -0.038 | -0.4620 | No | ||
| 26 | RNASEH2A | 12819 | 13772 | -0.058 | -0.5102 | No | ||
| 27 | ENPP3 | 19803 | 13863 | -0.060 | -0.5133 | No | ||
| 28 | ISG20 | 18210 | 14959 | -0.107 | -0.5692 | No | ||
| 29 | RNASE1 | 21845 | 14974 | -0.108 | -0.5668 | No | ||
| 30 | OGG1 | 17331 | 15006 | -0.112 | -0.5652 | No | ||
| 31 | RPP40 | 21491 | 15101 | -0.119 | -0.5668 | No | ||
| 32 | EXO1 | 14035 4135 | 15657 | -0.182 | -0.5914 | No | ||
| 33 | PPP1R8 | 15730 | 16321 | -0.339 | -0.6173 | No | ||
| 34 | N4BP2 | 16837 | 16716 | -0.496 | -0.6240 | Yes | ||
| 35 | DFFA | 4627 | 16893 | -0.585 | -0.6165 | Yes | ||
| 36 | NTHL1 | 23357 | 17063 | -0.685 | -0.6057 | Yes | ||
| 37 | MRE11A | 3014 19560 | 17156 | -0.746 | -0.5890 | Yes | ||
| 38 | MAP1S | 11279 | 17251 | -0.827 | -0.5700 | Yes | ||
| 39 | POP4 | 7261 | 17366 | -0.916 | -0.5495 | Yes | ||
| 40 | RNASEH1 | 21302 | 17469 | -0.991 | -0.5262 | Yes | ||
| 41 | EXOSC7 | 19256 | 17939 | -1.431 | -0.5098 | Yes | ||
| 42 | NME1 | 9467 | 17986 | -1.490 | -0.4690 | Yes | ||
| 43 | APEX1 | 22028 | 18030 | -1.556 | -0.4260 | Yes | ||
| 44 | EXOSC2 | 15044 | 18155 | -1.702 | -0.3832 | Yes | ||
| 45 | DICER1 | 20989 | 18195 | -1.783 | -0.3335 | Yes | ||
| 46 | RNASE6 | 13439 | 18464 | -2.474 | -0.2760 | Yes | ||
| 47 | ERCC5 | 14255 4097 | 18568 | -3.343 | -0.1843 | Yes | ||
| 48 | TP53 | 20822 | 18610 | -6.426 | 0.0003 | Yes |