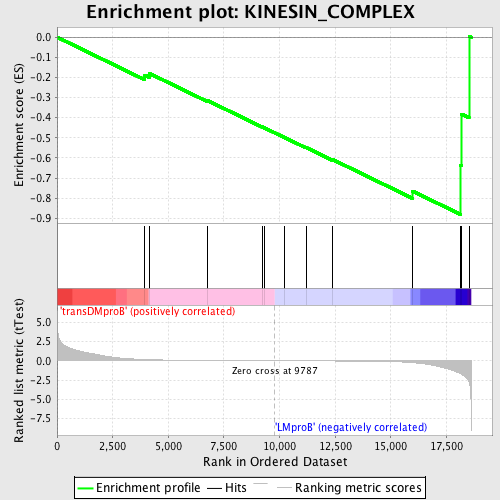
Profile of the Running ES Score & Positions of GeneSet Members on the Rank Ordered List
| Dataset | Set_04_transDMproB_versus_LMproB.phenotype_transDMproB_versus_LMproB.cls #transDMproB_versus_LMproB |
| Phenotype | phenotype_transDMproB_versus_LMproB.cls#transDMproB_versus_LMproB |
| Upregulated in class | LMproB |
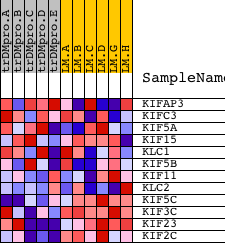
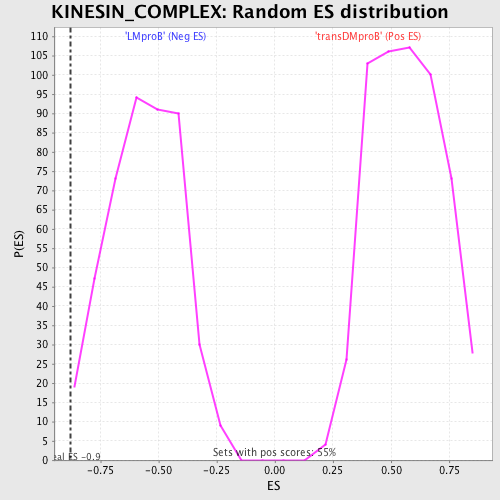
| GeneSet | KINESIN_COMPLEX |
| Enrichment Score (ES) | -0.88065386 |
| Normalized Enrichment Score (NES) | -1.5762776 |
| Nominal p-value | 0.004415011 |
| FDR q-value | 0.7768511 |
| FWER p-Value | 0.979 |
| PROBE | DESCRIPTION (from dataset) | GENE SYMBOL | GENE_TITLE | RANK IN GENE LIST | RANK METRIC SCORE | RUNNING ES | CORE ENRICHMENT | |
|---|---|---|---|---|---|---|---|---|
| 1 | KIFAP3 | 3962 14078 9224 | 3937 | 0.157 | -0.1886 | No | ||
| 2 | KIFC3 | 9227 | 4157 | 0.137 | -0.1804 | No | ||
| 3 | KIF5A | 9222 | 6771 | 0.038 | -0.3152 | No | ||
| 4 | KIF15 | 9955 5563 19257 | 9212 | 0.006 | -0.4455 | No | ||
| 5 | KLC1 | 4959 369 2156 384 | 9342 | 0.005 | -0.4517 | No | ||
| 6 | KIF5B | 4955 2031 | 10216 | -0.005 | -0.4979 | No | ||
| 7 | KIF11 | 23873 | 11190 | -0.015 | -0.5480 | No | ||
| 8 | KLC2 | 23973 3701 | 12395 | -0.031 | -0.6082 | No | ||
| 9 | KIF5C | 15014 | 15970 | -0.246 | -0.7643 | Yes | ||
| 10 | KIF3C | 9220 4954 | 18135 | -1.673 | -0.6357 | Yes | ||
| 11 | KIF23 | 19091 | 18180 | -1.748 | -0.3823 | Yes | ||
| 12 | KIF2C | 15789 | 18518 | -2.771 | 0.0053 | Yes |