Profile of the Running ES Score & Positions of GeneSet Members on the Rank Ordered List
| Dataset | Set_04_transDMproB_versus_LMproB.phenotype_transDMproB_versus_LMproB.cls #transDMproB_versus_LMproB |
| Phenotype | phenotype_transDMproB_versus_LMproB.cls#transDMproB_versus_LMproB |
| Upregulated in class | transDMproB |
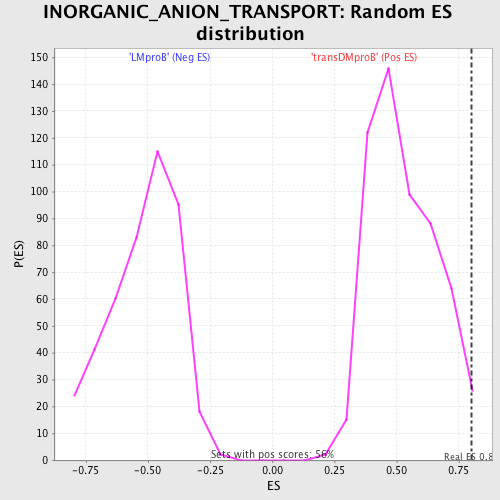
| GeneSet | INORGANIC_ANION_TRANSPORT |
| Enrichment Score (ES) | 0.80263865 |
| Normalized Enrichment Score (NES) | 1.5170342 |
| Nominal p-value | 0.008896797 |
| FDR q-value | 0.43191203 |
| FWER p-Value | 0.999 |
| PROBE | DESCRIPTION (from dataset) | GENE SYMBOL | GENE_TITLE | RANK IN GENE LIST | RANK METRIC SCORE | RUNNING ES | CORE ENRICHMENT | |
|---|---|---|---|---|---|---|---|---|
| 1 | CLIC1 | 23262 | 283 | 2.061 | 0.8026 | Yes | ||
| 2 | FXYD1 | 17874 85 | 4860 | 0.092 | 0.5931 | No | ||
| 3 | CLIC5 | 23229 | 6414 | 0.045 | 0.5274 | No | ||
| 4 | FXYD3 | 9370 | 6546 | 0.042 | 0.5372 | No | ||
| 5 | SLC26A2 | 23427 | 6694 | 0.040 | 0.5450 | No | ||
| 6 | NMUR1 | 13898 | 7244 | 0.031 | 0.5276 | No | ||
| 7 | SLC26A4 | 21089 | 7323 | 0.029 | 0.5350 | No | ||
| 8 | CLIC3 | 15082 | 7855 | 0.022 | 0.5151 | No | ||
| 9 | BEST1 | 23747 | 8020 | 0.019 | 0.5140 | No | ||
| 10 | SLC13A4 | 17185 | 8989 | 0.009 | 0.4653 | No | ||
| 11 | SLC34A2 | 16845 | 9923 | -0.002 | 0.4158 | No | ||
| 12 | GLRA1 | 9021 | 10567 | -0.008 | 0.3846 | No | ||
| 13 | SLC17A7 | 13081 | 10621 | -0.009 | 0.3853 | No | ||
| 14 | SLC34A1 | 9824 | 10655 | -0.009 | 0.3871 | No | ||
| 15 | SLC34A3 | 14664 | 12954 | -0.040 | 0.2794 | No | ||
| 16 | SLC17A1 | 21693 | 13958 | -0.063 | 0.2504 | No |