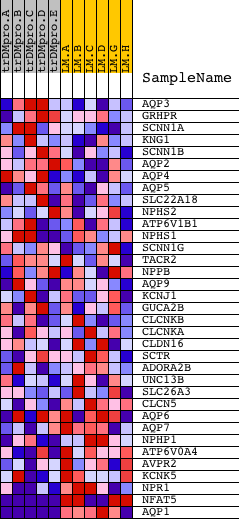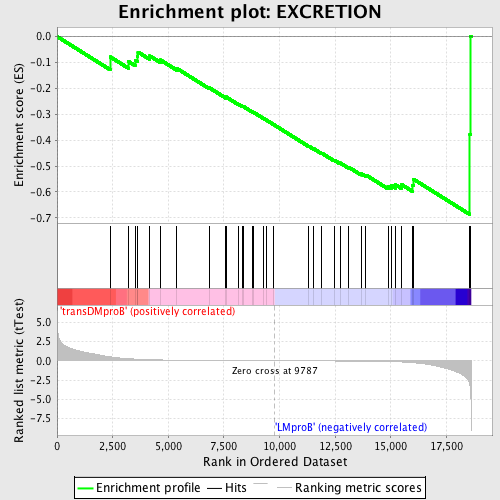
Profile of the Running ES Score & Positions of GeneSet Members on the Rank Ordered List
| Dataset | Set_04_transDMproB_versus_LMproB.phenotype_transDMproB_versus_LMproB.cls #transDMproB_versus_LMproB |
| Phenotype | phenotype_transDMproB_versus_LMproB.cls#transDMproB_versus_LMproB |
| Upregulated in class | LMproB |
| GeneSet | EXCRETION |
| Enrichment Score (ES) | -0.68705493 |
| Normalized Enrichment Score (NES) | -1.5505556 |
| Nominal p-value | 0.011848342 |
| FDR q-value | 0.56353015 |
| FWER p-Value | 0.995 |
| PROBE | DESCRIPTION (from dataset) | GENE SYMBOL | GENE_TITLE | RANK IN GENE LIST | RANK METRIC SCORE | RUNNING ES | CORE ENRICHMENT | |
|---|---|---|---|---|---|---|---|---|
| 1 | AQP3 | 15915 | 2390 | 0.506 | -0.0787 | No | ||
| 2 | GRHPR | 16224 | 3215 | 0.263 | -0.0971 | No | ||
| 3 | SCNN1A | 17278 | 3508 | 0.213 | -0.0918 | No | ||
| 4 | KNG1 | 9244 22809 | 3612 | 0.197 | -0.0779 | No | ||
| 5 | SCNN1B | 18094 | 3633 | 0.194 | -0.0598 | No | ||
| 6 | AQP2 | 22366 | 4164 | 0.136 | -0.0749 | No | ||
| 7 | AQP4 | 4403 | 4642 | 0.103 | -0.0904 | No | ||
| 8 | AQP5 | 22365 | 5386 | 0.072 | -0.1233 | No | ||
| 9 | SLC22A18 | 18000 | 6833 | 0.037 | -0.1974 | No | ||
| 10 | NPHS2 | 4111 9292 5013 14088 | 7586 | 0.025 | -0.2354 | No | ||
| 11 | ATP6V1B1 | 8499 | 7591 | 0.025 | -0.2331 | No | ||
| 12 | NPHS1 | 12048 | 8166 | 0.018 | -0.2622 | No | ||
| 13 | SCNN1G | 18095 | 8337 | 0.016 | -0.2698 | No | ||
| 14 | TACR2 | 20004 | 8378 | 0.015 | -0.2705 | No | ||
| 15 | NPPB | 15994 | 8787 | 0.011 | -0.2913 | No | ||
| 16 | AQP9 | 7218 | 8825 | 0.010 | -0.2923 | No | ||
| 17 | KCNJ1 | 3121 12110 | 9272 | 0.006 | -0.3157 | No | ||
| 18 | GUCA2B | 15773 | 9408 | 0.004 | -0.3226 | No | ||
| 19 | CLCNKB | 7105 | 9730 | 0.001 | -0.3398 | No | ||
| 20 | CLCNKA | 15690 | 11301 | -0.016 | -0.4227 | No | ||
| 21 | CLDN16 | 22802 | 11535 | -0.019 | -0.4333 | No | ||
| 22 | SCTR | 14157 | 11894 | -0.024 | -0.4502 | No | ||
| 23 | ADORA2B | 20850 | 12457 | -0.031 | -0.4774 | No | ||
| 24 | UNC13B | 10255 | 12722 | -0.036 | -0.4881 | No | ||
| 25 | SLC26A3 | 21298 | 13092 | -0.043 | -0.5037 | No | ||
| 26 | CLCN5 | 24204 | 13668 | -0.055 | -0.5293 | No | ||
| 27 | AQP6 | 22364 8621 | 13883 | -0.061 | -0.5348 | No | ||
| 28 | AQP7 | 15916 8622 4404 | 14879 | -0.101 | -0.5783 | Yes | ||
| 29 | NPHP1 | 2773 14435 | 15015 | -0.112 | -0.5745 | Yes | ||
| 30 | ATP6V0A4 | 8934 | 15216 | -0.128 | -0.5726 | Yes | ||
| 31 | AVPR2 | 8646 | 15490 | -0.157 | -0.5719 | Yes | ||
| 32 | KCNK5 | 4946 9212 | 15977 | -0.247 | -0.5737 | Yes | ||
| 33 | NPR1 | 9480 | 16012 | -0.254 | -0.5504 | Yes | ||
| 34 | NFAT5 | 3921 7037 12036 | 18552 | -3.129 | -0.3783 | Yes | ||
| 35 | AQP1 | 1057 17437 | 18587 | -3.868 | 0.0016 | Yes |