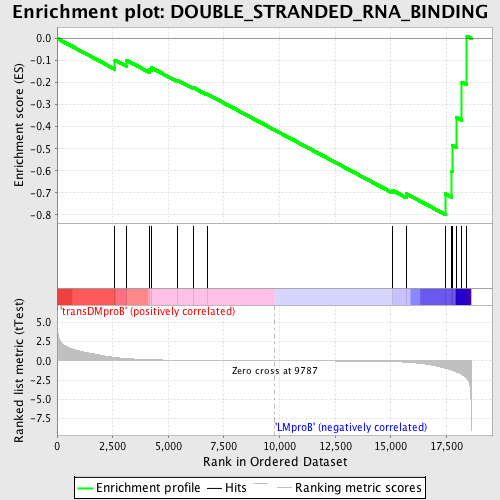
Profile of the Running ES Score & Positions of GeneSet Members on the Rank Ordered List
| Dataset | Set_04_transDMproB_versus_LMproB.phenotype_transDMproB_versus_LMproB.cls #transDMproB_versus_LMproB |
| Phenotype | phenotype_transDMproB_versus_LMproB.cls#transDMproB_versus_LMproB |
| Upregulated in class | LMproB |
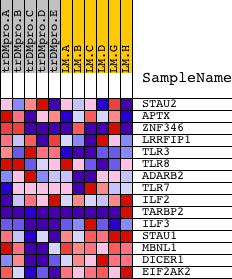
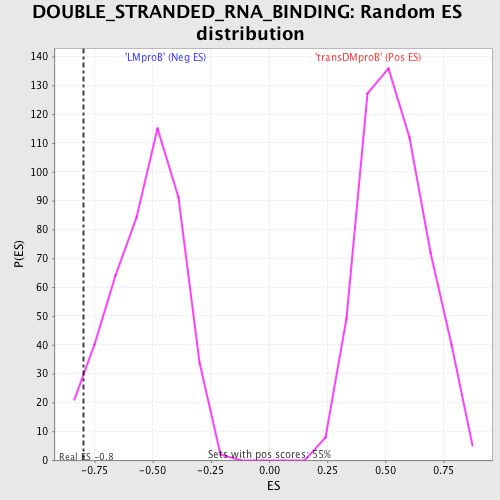
| GeneSet | DOUBLE_STRANDED_RNA_BINDING |
| Enrichment Score (ES) | -0.7978402 |
| Normalized Enrichment Score (NES) | -1.5073723 |
| Nominal p-value | 0.039911307 |
| FDR q-value | 0.69515145 |
| FWER p-Value | 1.0 |
| PROBE | DESCRIPTION (from dataset) | GENE SYMBOL | GENE_TITLE | RANK IN GENE LIST | RANK METRIC SCORE | RUNNING ES | CORE ENRICHMENT | |
|---|---|---|---|---|---|---|---|---|
| 1 | STAU2 | 6615 | 2599 | 0.429 | -0.0983 | No | ||
| 2 | APTX | 2455 7291 | 3114 | 0.283 | -0.0986 | No | ||
| 3 | ZNF346 | 3163 6517 3193 | 4149 | 0.137 | -0.1410 | No | ||
| 4 | LRRFIP1 | 14191 4007 3965 | 4236 | 0.129 | -0.1331 | No | ||
| 5 | TLR3 | 18884 | 5413 | 0.071 | -0.1895 | No | ||
| 6 | TLR8 | 9308 | 6113 | 0.051 | -0.2221 | No | ||
| 7 | ADARB2 | 8245 | 6737 | 0.039 | -0.2519 | No | ||
| 8 | TLR7 | 24004 | 15074 | -0.117 | -0.6887 | No | ||
| 9 | ILF2 | 12582 | 15696 | -0.188 | -0.7040 | Yes | ||
| 10 | TARBP2 | 10033 10034 5626 | 17443 | -0.972 | -0.7039 | Yes | ||
| 11 | ILF3 | 3110 3030 9176 | 17724 | -1.199 | -0.6032 | Yes | ||
| 12 | STAU1 | 9910 | 17761 | -1.243 | -0.4851 | Yes | ||
| 13 | MBNL1 | 1921 15582 | 17938 | -1.428 | -0.3566 | Yes | ||
| 14 | DICER1 | 20989 | 18195 | -1.783 | -0.1982 | Yes | ||
| 15 | EIF2AK2 | 22892 | 18423 | -2.286 | 0.0104 | Yes |