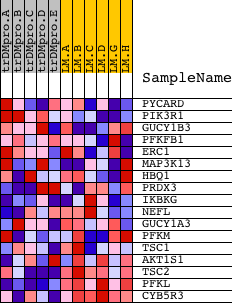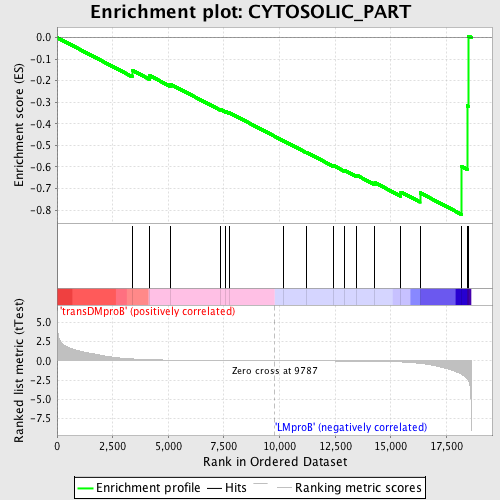
Profile of the Running ES Score & Positions of GeneSet Members on the Rank Ordered List
| Dataset | Set_04_transDMproB_versus_LMproB.phenotype_transDMproB_versus_LMproB.cls #transDMproB_versus_LMproB |
| Phenotype | phenotype_transDMproB_versus_LMproB.cls#transDMproB_versus_LMproB |
| Upregulated in class | LMproB |
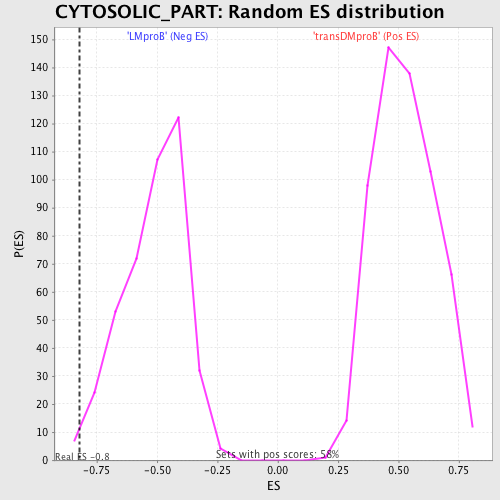
| GeneSet | CYTOSOLIC_PART |
| Enrichment Score (ES) | -0.82036084 |
| Normalized Enrichment Score (NES) | -1.5951636 |
| Nominal p-value | 0.011876484 |
| FDR q-value | 0.7243616 |
| FWER p-Value | 0.956 |
| PROBE | DESCRIPTION (from dataset) | GENE SYMBOL | GENE_TITLE | RANK IN GENE LIST | RANK METRIC SCORE | RUNNING ES | CORE ENRICHMENT | |
|---|---|---|---|---|---|---|---|---|
| 1 | PYCARD | 7341 | 3376 | 0.234 | -0.1518 | No | ||
| 2 | PIK3R1 | 3170 | 4146 | 0.138 | -0.1757 | No | ||
| 3 | GUCY1B3 | 15311 | 5093 | 0.082 | -0.2162 | No | ||
| 4 | PFKFB1 | 9552 | 7345 | 0.029 | -0.3335 | No | ||
| 5 | ERC1 | 1013 17021 995 1136 | 7585 | 0.025 | -0.3431 | No | ||
| 6 | MAP3K13 | 22814 | 7745 | 0.023 | -0.3487 | No | ||
| 7 | HBQ1 | 20928 | 10188 | -0.005 | -0.4795 | No | ||
| 8 | PRDX3 | 23632 | 11218 | -0.016 | -0.5328 | No | ||
| 9 | IKBKG | 2570 2562 4908 | 12403 | -0.031 | -0.5926 | No | ||
| 10 | NEFL | 9459 | 12918 | -0.039 | -0.6152 | No | ||
| 11 | GUCY1A3 | 7216 12245 15310 | 13445 | -0.050 | -0.6372 | No | ||
| 12 | PFKM | 5243 9554 | 14285 | -0.073 | -0.6730 | No | ||
| 13 | TSC1 | 7235 | 15448 | -0.153 | -0.7162 | No | ||
| 14 | AKT1S1 | 12557 | 16312 | -0.338 | -0.7197 | Yes | ||
| 15 | TSC2 | 23090 | 18185 | -1.757 | -0.5975 | Yes | ||
| 16 | PFKL | 9553 | 18433 | -2.323 | -0.3160 | Yes | ||
| 17 | CYB5R3 | 2313 22186 | 18489 | -2.568 | 0.0068 | Yes |