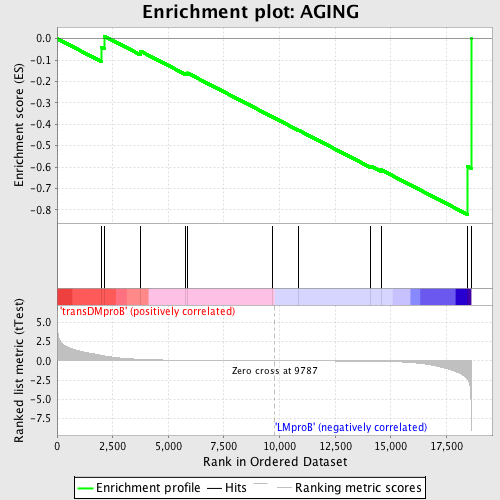
Profile of the Running ES Score & Positions of GeneSet Members on the Rank Ordered List
| Dataset | Set_04_transDMproB_versus_LMproB.phenotype_transDMproB_versus_LMproB.cls #transDMproB_versus_LMproB |
| Phenotype | phenotype_transDMproB_versus_LMproB.cls#transDMproB_versus_LMproB |
| Upregulated in class | LMproB |
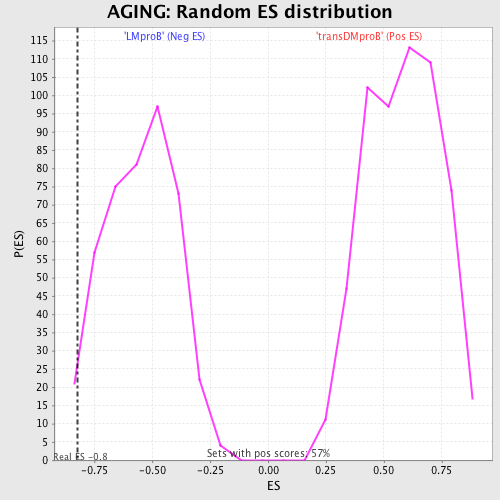
| GeneSet | AGING |
| Enrichment Score (ES) | -0.82131755 |
| Normalized Enrichment Score (NES) | -1.4910041 |
| Nominal p-value | 0.025581395 |
| FDR q-value | 0.6894762 |
| FWER p-Value | 1.0 |
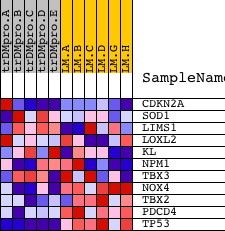
| PROBE | DESCRIPTION (from dataset) | GENE SYMBOL | GENE_TITLE | RANK IN GENE LIST | RANK METRIC SCORE | RUNNING ES | CORE ENRICHMENT | |
|---|---|---|---|---|---|---|---|---|
| 1 | CDKN2A | 2491 15841 | 1978 | 0.701 | -0.0403 | No | ||
| 2 | SOD1 | 9846 | 2119 | 0.635 | 0.0119 | No | ||
| 3 | LIMS1 | 8493 4290 | 3748 | 0.183 | -0.0584 | No | ||
| 4 | LOXL2 | 8256 | 5753 | 0.061 | -0.1604 | No | ||
| 5 | KL | 16611 | 5854 | 0.058 | -0.1603 | No | ||
| 6 | NPM1 | 1196 | 9669 | 0.001 | -0.3652 | No | ||
| 7 | TBX3 | 16723 | 10868 | -0.012 | -0.4285 | No | ||
| 8 | NOX4 | 18196 | 14098 | -0.067 | -0.5957 | No | ||
| 9 | TBX2 | 20720 | 14571 | -0.084 | -0.6132 | Yes | ||
| 10 | PDCD4 | 5232 23816 | 18445 | -2.393 | -0.5960 | Yes | ||
| 11 | TP53 | 20822 | 18610 | -6.426 | 0.0003 | Yes |