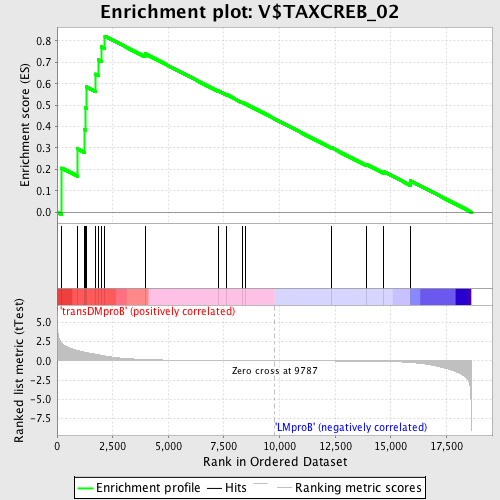
Profile of the Running ES Score & Positions of GeneSet Members on the Rank Ordered List
| Dataset | Set_04_transDMproB_versus_LMproB.phenotype_transDMproB_versus_LMproB.cls #transDMproB_versus_LMproB |
| Phenotype | phenotype_transDMproB_versus_LMproB.cls#transDMproB_versus_LMproB |
| Upregulated in class | transDMproB |
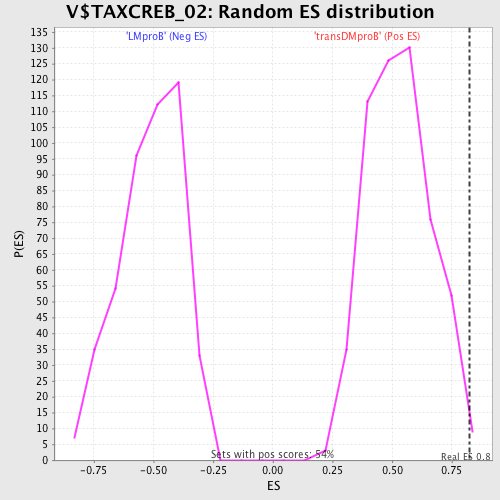
| GeneSet | V$TAXCREB_02 |
| Enrichment Score (ES) | 0.82272315 |
| Normalized Enrichment Score (NES) | 1.5555469 |
| Nominal p-value | 0.005514706 |
| FDR q-value | 0.6952071 |
| FWER p-Value | 0.544 |
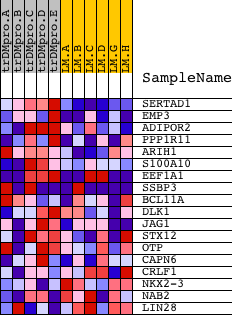
| PROBE | DESCRIPTION (from dataset) | GENE SYMBOL | GENE_TITLE | RANK IN GENE LIST | RANK METRIC SCORE | RUNNING ES | CORE ENRICHMENT | |
|---|---|---|---|---|---|---|---|---|
| 1 | SERTAD1 | 18326 | 200 | 2.262 | 0.2065 | Yes | ||
| 2 | EMP3 | 17824 968 | 905 | 1.336 | 0.2970 | Yes | ||
| 3 | ADIPOR2 | 17024 | 1235 | 1.108 | 0.3858 | Yes | ||
| 4 | PPP1R11 | 8025 | 1278 | 1.084 | 0.4876 | Yes | ||
| 5 | ARIH1 | 6210 | 1320 | 1.047 | 0.5860 | Yes | ||
| 6 | S100A10 | 15518 | 1723 | 0.847 | 0.6457 | Yes | ||
| 7 | EEF1A1 | 38 38 8879 | 1861 | 0.768 | 0.7121 | Yes | ||
| 8 | SSBP3 | 2439 7814 2431 | 1986 | 0.696 | 0.7723 | Yes | ||
| 9 | BCL11A | 4691 | 2149 | 0.616 | 0.8227 | Yes | ||
| 10 | DLK1 | 4632 | 3956 | 0.156 | 0.7406 | No | ||
| 11 | JAG1 | 14415 | 7242 | 0.031 | 0.5669 | No | ||
| 12 | STX12 | 4140 | 7625 | 0.025 | 0.5488 | No | ||
| 13 | OTP | 21582 | 8333 | 0.016 | 0.5123 | No | ||
| 14 | CAPN6 | 24041 | 8487 | 0.014 | 0.5054 | No | ||
| 15 | CRLF1 | 18588 | 12346 | -0.030 | 0.3008 | No | ||
| 16 | NKX2-3 | 5177 23845 | 13894 | -0.061 | 0.2235 | No | ||
| 17 | NAB2 | 5146 | 14691 | -0.090 | 0.1894 | No | ||
| 18 | LIN28 | 15723 | 15884 | -0.225 | 0.1469 | No |