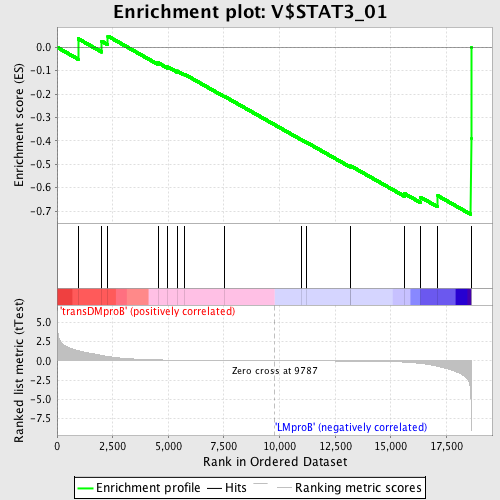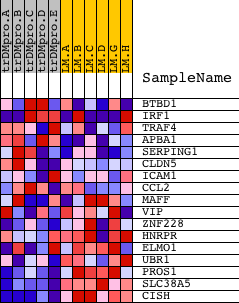
Profile of the Running ES Score & Positions of GeneSet Members on the Rank Ordered List
| Dataset | Set_04_transDMproB_versus_LMproB.phenotype_transDMproB_versus_LMproB.cls #transDMproB_versus_LMproB |
| Phenotype | phenotype_transDMproB_versus_LMproB.cls#transDMproB_versus_LMproB |
| Upregulated in class | LMproB |
| GeneSet | V$STAT3_01 |
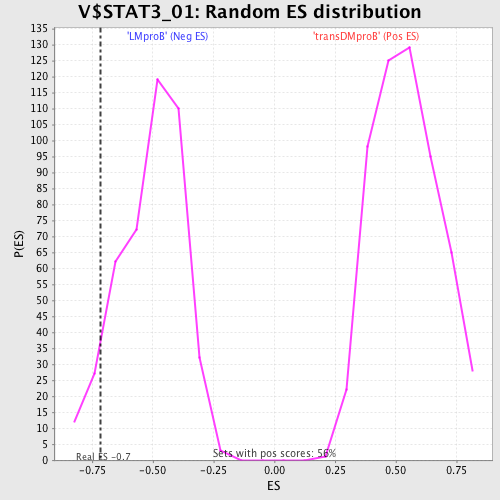
| Enrichment Score (ES) | -0.71444637 |
| Normalized Enrichment Score (NES) | -1.4101768 |
| Nominal p-value | 0.070938215 |
| FDR q-value | 0.60496444 |
| FWER p-Value | 0.99 |

| PROBE | DESCRIPTION (from dataset) | GENE SYMBOL | GENE_TITLE | RANK IN GENE LIST | RANK METRIC SCORE | RUNNING ES | CORE ENRICHMENT | |
|---|---|---|---|---|---|---|---|---|
| 1 | BTBD1 | 13519 | 949 | 1.305 | 0.0365 | No | ||
| 2 | IRF1 | 1336 1258 1433 9182 | 2007 | 0.688 | 0.0258 | No | ||
| 3 | TRAF4 | 10217 5796 1400 | 2283 | 0.548 | 0.0477 | No | ||
| 4 | APBA1 | 11483 | 4535 | 0.109 | -0.0660 | No | ||
| 5 | SERPING1 | 14546 | 4976 | 0.087 | -0.0838 | No | ||
| 6 | CLDN5 | 22826 | 5390 | 0.072 | -0.1012 | No | ||
| 7 | ICAM1 | 19545 | 5711 | 0.062 | -0.1143 | No | ||
| 8 | CCL2 | 9788 | 7519 | 0.026 | -0.2097 | No | ||
| 9 | MAFF | 22423 2243 | 10976 | -0.013 | -0.3946 | No | ||
| 10 | VIP | 20096 | 11191 | -0.015 | -0.4051 | No | ||
| 11 | ZNF228 | 18357 | 13179 | -0.044 | -0.5090 | No | ||
| 12 | HNRPR | 13196 7909 2500 | 13199 | -0.044 | -0.5070 | No | ||
| 13 | ELMO1 | 3275 8939 3202 3271 3254 3235 3164 3175 3274 3188 3293 3214 3218 3239 | 15613 | -0.175 | -0.6251 | No | ||
| 14 | UBR1 | 5828 | 16340 | -0.347 | -0.6408 | Yes | ||
| 15 | PROS1 | 22725 | 17113 | -0.715 | -0.6344 | Yes | ||
| 16 | SLC38A5 | 24388 | 18603 | -4.850 | -0.3893 | Yes | ||
| 17 | CISH | 8743 | 18609 | -5.815 | 0.0004 | Yes |

