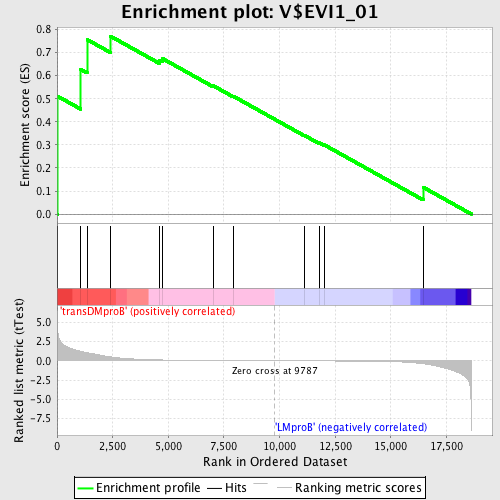
Profile of the Running ES Score & Positions of GeneSet Members on the Rank Ordered List
| Dataset | Set_04_transDMproB_versus_LMproB.phenotype_transDMproB_versus_LMproB.cls #transDMproB_versus_LMproB |
| Phenotype | phenotype_transDMproB_versus_LMproB.cls#transDMproB_versus_LMproB |
| Upregulated in class | transDMproB |
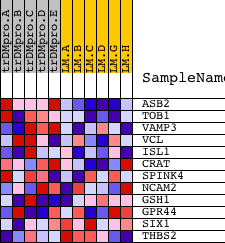
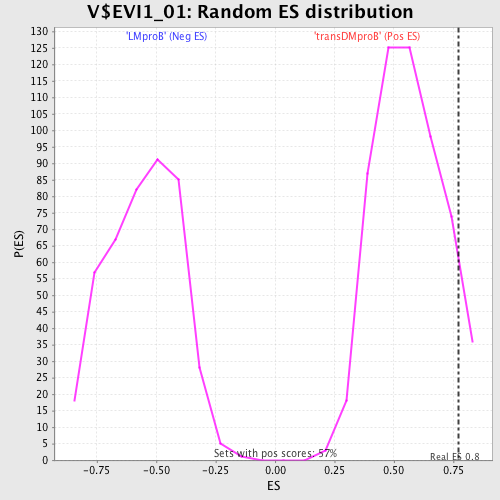
| GeneSet | V$EVI1_01 |
| Enrichment Score (ES) | 0.7714676 |
| Normalized Enrichment Score (NES) | 1.3676147 |
| Nominal p-value | 0.08303887 |
| FDR q-value | 0.9323984 |
| FWER p-Value | 1.0 |
| PROBE | DESCRIPTION (from dataset) | GENE SYMBOL | GENE_TITLE | RANK IN GENE LIST | RANK METRIC SCORE | RUNNING ES | CORE ENRICHMENT | |
|---|---|---|---|---|---|---|---|---|
| 1 | ASB2 | 20996 | 33 | 3.636 | 0.5102 | Yes | ||
| 2 | TOB1 | 20703 | 1063 | 1.224 | 0.6273 | Yes | ||
| 3 | VAMP3 | 15660 | 1351 | 1.026 | 0.7564 | Yes | ||
| 4 | VCL | 22083 | 2393 | 0.505 | 0.7715 | Yes | ||
| 5 | ISL1 | 21338 | 4608 | 0.106 | 0.6673 | No | ||
| 6 | CRAT | 4557 2804 2896 | 4749 | 0.097 | 0.6735 | No | ||
| 7 | SPINK4 | 16241 | 7013 | 0.034 | 0.5566 | No | ||
| 8 | NCAM2 | 9445 5150 | 7926 | 0.021 | 0.5105 | No | ||
| 9 | GSH1 | 16622 | 11115 | -0.014 | 0.3412 | No | ||
| 10 | GPR44 | 23926 | 11784 | -0.023 | 0.3085 | No | ||
| 11 | SIX1 | 9821 | 12014 | -0.025 | 0.2998 | No | ||
| 12 | THBS2 | 5749 | 16456 | -0.391 | 0.1161 | No |