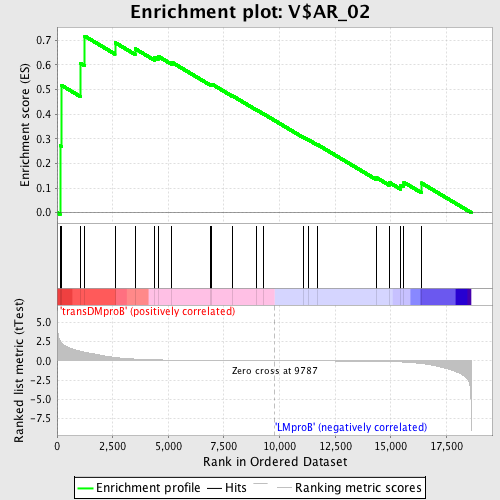
Profile of the Running ES Score & Positions of GeneSet Members on the Rank Ordered List
| Dataset | Set_04_transDMproB_versus_LMproB.phenotype_transDMproB_versus_LMproB.cls #transDMproB_versus_LMproB |
| Phenotype | phenotype_transDMproB_versus_LMproB.cls#transDMproB_versus_LMproB |
| Upregulated in class | transDMproB |
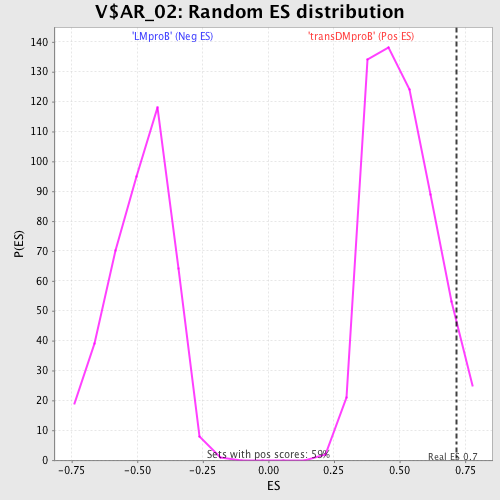
| GeneSet | V$AR_02 |
| Enrichment Score (ES) | 0.7164533 |
| Normalized Enrichment Score (NES) | 1.4110404 |
| Nominal p-value | 0.05972696 |
| FDR q-value | 0.93568 |
| FWER p-Value | 0.999 |
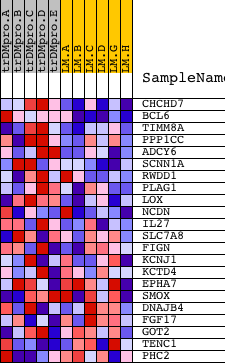
| PROBE | DESCRIPTION (from dataset) | GENE SYMBOL | GENE_TITLE | RANK IN GENE LIST | RANK METRIC SCORE | RUNNING ES | CORE ENRICHMENT | |
|---|---|---|---|---|---|---|---|---|
| 1 | CHCHD7 | 16280 | 135 | 2.545 | 0.2726 | Yes | ||
| 2 | BCL6 | 22624 | 205 | 2.250 | 0.5163 | Yes | ||
| 3 | TIMM8A | 24062 | 1059 | 1.226 | 0.6053 | Yes | ||
| 4 | PPP1CC | 9609 5283 | 1244 | 1.101 | 0.7165 | Yes | ||
| 5 | ADCY6 | 22139 2283 8551 | 2603 | 0.428 | 0.6905 | No | ||
| 6 | SCNN1A | 17278 | 3508 | 0.213 | 0.6652 | No | ||
| 7 | RWDD1 | 7306 | 4381 | 0.118 | 0.6313 | No | ||
| 8 | PLAG1 | 7148 15949 12161 | 4540 | 0.109 | 0.6348 | No | ||
| 9 | LOX | 23438 | 5160 | 0.079 | 0.6102 | No | ||
| 10 | NCDN | 15756 2487 6471 | 6890 | 0.036 | 0.5213 | No | ||
| 11 | IL27 | 17636 | 6956 | 0.035 | 0.5216 | No | ||
| 12 | SLC7A8 | 3611 21833 | 7867 | 0.022 | 0.4751 | No | ||
| 13 | FIGN | 14575 | 8983 | 0.009 | 0.4161 | No | ||
| 14 | KCNJ1 | 3121 12110 | 9272 | 0.006 | 0.4012 | No | ||
| 15 | KCTD4 | 21956 | 11066 | -0.014 | 0.3063 | No | ||
| 16 | EPHA7 | 8909 4674 | 11300 | -0.016 | 0.2956 | No | ||
| 17 | SMOX | 10455 2940 2737 2952 | 11695 | -0.022 | 0.2767 | No | ||
| 18 | DNAJB4 | 12451 1916 1832 | 14368 | -0.077 | 0.1415 | No | ||
| 19 | FGF17 | 21757 | 14924 | -0.105 | 0.1232 | No | ||
| 20 | GOT2 | 4792 3901 | 15443 | -0.152 | 0.1120 | No | ||
| 21 | TENC1 | 22349 9927 | 15586 | -0.171 | 0.1232 | No | ||
| 22 | PHC2 | 16075 | 16372 | -0.361 | 0.1207 | No |