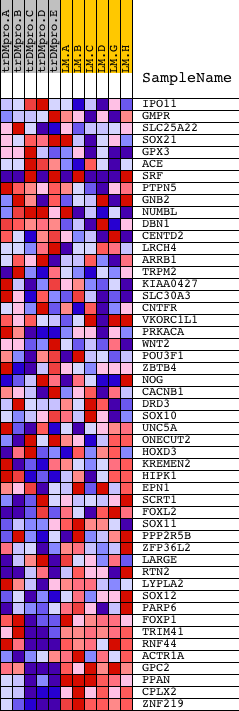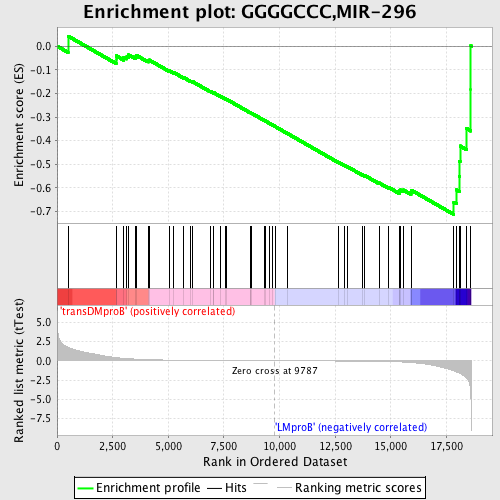
Profile of the Running ES Score & Positions of GeneSet Members on the Rank Ordered List
| Dataset | Set_04_transDMproB_versus_LMproB.phenotype_transDMproB_versus_LMproB.cls #transDMproB_versus_LMproB |
| Phenotype | phenotype_transDMproB_versus_LMproB.cls#transDMproB_versus_LMproB |
| Upregulated in class | LMproB |
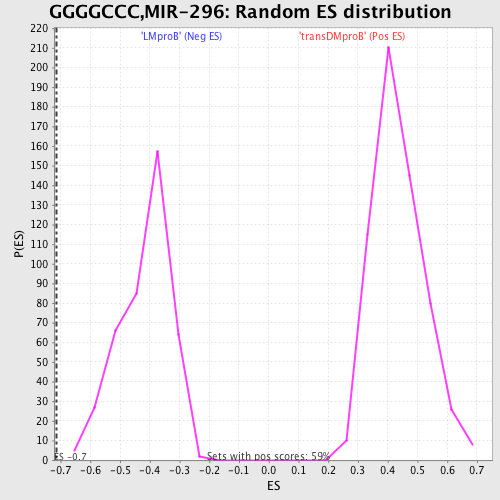
| GeneSet | GGGGCCC,MIR-296 |
| Enrichment Score (ES) | -0.7121482 |
| Normalized Enrichment Score (NES) | -1.7089676 |
| Nominal p-value | 0.0 |
| FDR q-value | 0.0950213 |
| FWER p-Value | 0.076 |
| PROBE | DESCRIPTION (from dataset) | GENE SYMBOL | GENE_TITLE | RANK IN GENE LIST | RANK METRIC SCORE | RUNNING ES | CORE ENRICHMENT | |
|---|---|---|---|---|---|---|---|---|
| 1 | IPO11 | 21353 | 494 | 1.723 | 0.0424 | No | ||
| 2 | GMPR | 21651 | 2653 | 0.412 | -0.0574 | No | ||
| 3 | SLC25A22 | 12671 | 2655 | 0.411 | -0.0409 | No | ||
| 4 | SOX21 | 27 10278 2778 | 2995 | 0.311 | -0.0467 | No | ||
| 5 | GPX3 | 20880 | 3139 | 0.279 | -0.0433 | No | ||
| 6 | ACE | 1419 4313 | 3221 | 0.261 | -0.0372 | No | ||
| 7 | SRF | 22961 1597 | 3535 | 0.209 | -0.0457 | No | ||
| 8 | PTPN5 | 17817 | 3558 | 0.204 | -0.0387 | No | ||
| 9 | GNB2 | 9026 | 4087 | 0.143 | -0.0614 | No | ||
| 10 | NUMBL | 1663 9496 | 4138 | 0.139 | -0.0585 | No | ||
| 11 | DBN1 | 21452 | 5051 | 0.083 | -0.1043 | No | ||
| 12 | CENTD2 | 1758 18169 2284 | 5239 | 0.076 | -0.1114 | No | ||
| 13 | LRCH4 | 10544 6090 | 5693 | 0.062 | -0.1333 | No | ||
| 14 | ARRB1 | 3890 8465 18178 4276 | 6015 | 0.054 | -0.1484 | No | ||
| 15 | TRPM2 | 19717 | 6091 | 0.052 | -0.1504 | No | ||
| 16 | KIAA0427 | 11228 | 6900 | 0.036 | -0.1924 | No | ||
| 17 | SLC30A3 | 5995 | 7019 | 0.034 | -0.1974 | No | ||
| 18 | CNTFR | 2515 15906 | 7038 | 0.034 | -0.1970 | No | ||
| 19 | VKORC1L1 | 102 7625 | 7335 | 0.029 | -0.2118 | No | ||
| 20 | PRKACA | 18549 3844 | 7558 | 0.026 | -0.2227 | No | ||
| 21 | WNT2 | 17212 | 7603 | 0.025 | -0.2241 | No | ||
| 22 | POU3F1 | 16093 | 8676 | 0.012 | -0.2814 | No | ||
| 23 | ZBTB4 | 13267 | 8682 | 0.012 | -0.2812 | No | ||
| 24 | NOG | 13663 | 8752 | 0.011 | -0.2844 | No | ||
| 25 | CACNB1 | 1443 1304 | 9319 | 0.005 | -0.3147 | No | ||
| 26 | DRD3 | 22750 | 9363 | 0.005 | -0.3168 | No | ||
| 27 | SOX10 | 22211 | 9554 | 0.003 | -0.3270 | No | ||
| 28 | UNC5A | 3288 21631 | 9673 | 0.001 | -0.3333 | No | ||
| 29 | ONECUT2 | 10346 | 9795 | -0.000 | -0.3398 | No | ||
| 30 | HOXD3 | 9115 | 10347 | -0.006 | -0.3692 | No | ||
| 31 | KREMEN2 | 23104 | 12668 | -0.035 | -0.4928 | No | ||
| 32 | HIPK1 | 4851 | 12922 | -0.039 | -0.5048 | No | ||
| 33 | EPN1 | 18401 | 13048 | -0.042 | -0.5099 | No | ||
| 34 | SCRT1 | 9303 | 13726 | -0.057 | -0.5441 | No | ||
| 35 | FOXL2 | 19345 | 13838 | -0.060 | -0.5477 | No | ||
| 36 | SOX11 | 5477 | 14475 | -0.081 | -0.5787 | No | ||
| 37 | PPP2R5B | 23994 | 14893 | -0.102 | -0.5971 | No | ||
| 38 | ZFP36L2 | 8662 | 15387 | -0.145 | -0.6178 | No | ||
| 39 | LARGE | 18837 | 15394 | -0.146 | -0.6123 | No | ||
| 40 | RTN2 | 9764 | 15434 | -0.151 | -0.6083 | No | ||
| 41 | LYPLA2 | 15708 | 15560 | -0.166 | -0.6084 | No | ||
| 42 | SOX12 | 5478 | 15908 | -0.229 | -0.6179 | No | ||
| 43 | PARP6 | 19419 2979 3156 | 15920 | -0.233 | -0.6092 | No | ||
| 44 | FOXP1 | 4242 | 17833 | -1.313 | -0.6596 | Yes | ||
| 45 | TRIM41 | 1251 20483 | 17963 | -1.459 | -0.6082 | Yes | ||
| 46 | RNF44 | 8364 | 18076 | -1.593 | -0.5504 | Yes | ||
| 47 | ACTR1A | 23653 | 18088 | -1.610 | -0.4866 | Yes | ||
| 48 | GPC2 | 16321 | 18116 | -1.642 | -0.4223 | Yes | ||
| 49 | PPAN | 19546 | 18399 | -2.221 | -0.3485 | Yes | ||
| 50 | CPLX2 | 8779 | 18596 | -4.366 | -0.1843 | Yes | ||
| 51 | ZNF219 | 12835 | 18599 | -4.629 | 0.0009 | Yes |