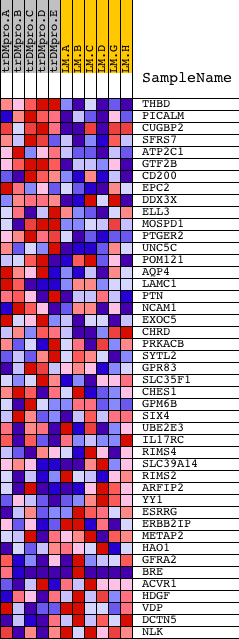
Profile of the Running ES Score & Positions of GeneSet Members on the Rank Ordered List
| Dataset | Set_04_transDMproB_versus_LMproB.phenotype_transDMproB_versus_LMproB.cls #transDMproB_versus_LMproB |
| Phenotype | phenotype_transDMproB_versus_LMproB.cls#transDMproB_versus_LMproB |
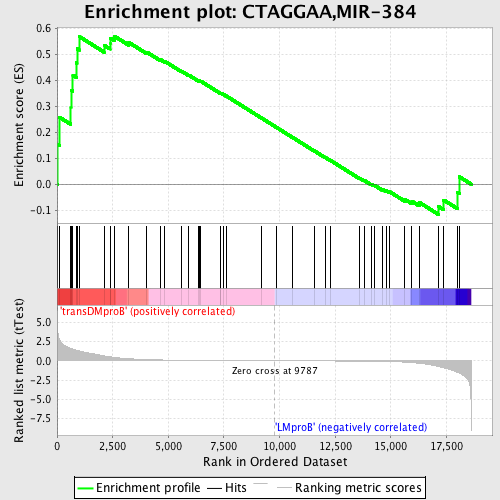
| Upregulated in class | transDMproB |
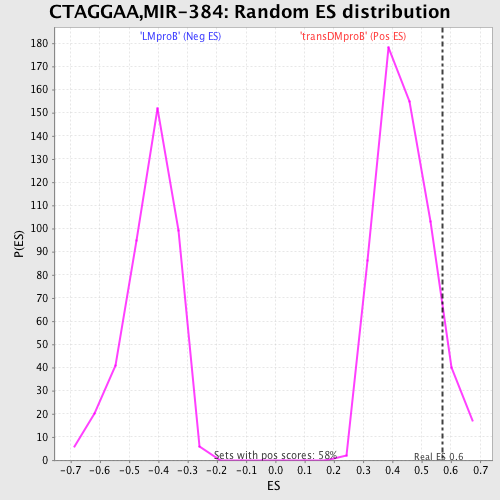
| GeneSet | CTAGGAA,MIR-384 |
| Enrichment Score (ES) | 0.5701971 |
| Normalized Enrichment Score (NES) | 1.2866296 |
| Nominal p-value | 0.09122203 |
| FDR q-value | 1.0 |
| FWER p-Value | 1.0 |
| PROBE | DESCRIPTION (from dataset) | GENE SYMBOL | GENE_TITLE | RANK IN GENE LIST | RANK METRIC SCORE | RUNNING ES | CORE ENRICHMENT | |
|---|---|---|---|---|---|---|---|---|
| 1 | THBD | 14404 | 28 | 3.785 | 0.1541 | Yes | ||
| 2 | PICALM | 18191 | 113 | 2.628 | 0.2575 | Yes | ||
| 3 | CUGBP2 | 4687 8923 | 623 | 1.608 | 0.2962 | Yes | ||
| 4 | SFRS7 | 22889 | 625 | 1.605 | 0.3621 | Yes | ||
| 5 | ATP2C1 | 10660 6178 | 712 | 1.517 | 0.4198 | Yes | ||
| 6 | GTF2B | 10489 | 872 | 1.367 | 0.4674 | Yes | ||
| 7 | CD200 | 9404 58 | 894 | 1.348 | 0.5217 | Yes | ||
| 8 | EPC2 | 15015 | 992 | 1.273 | 0.5688 | Yes | ||
| 9 | DDX3X | 24379 | 2114 | 0.640 | 0.5347 | Yes | ||
| 10 | ELL3 | 14455 | 2379 | 0.511 | 0.5415 | Yes | ||
| 11 | MOSPD1 | 12868 12869 7672 | 2384 | 0.509 | 0.5622 | Yes | ||
| 12 | PTGER2 | 22039 | 2571 | 0.437 | 0.5702 | Yes | ||
| 13 | UNC5C | 10256 | 3223 | 0.261 | 0.5459 | No | ||
| 14 | POM121 | 16343 | 4034 | 0.149 | 0.5084 | No | ||
| 15 | AQP4 | 4403 | 4642 | 0.103 | 0.4799 | No | ||
| 16 | LAMC1 | 13805 | 4841 | 0.092 | 0.4731 | No | ||
| 17 | PTN | 5323 | 5599 | 0.065 | 0.4350 | No | ||
| 18 | NCAM1 | 5149 | 5927 | 0.056 | 0.4197 | No | ||
| 19 | EXOC5 | 8370 | 6374 | 0.045 | 0.3975 | No | ||
| 20 | CHRD | 22817 | 6399 | 0.045 | 0.3981 | No | ||
| 21 | PRKACB | 15140 | 6459 | 0.044 | 0.3967 | No | ||
| 22 | SYTL2 | 18190 1539 3730 | 7344 | 0.029 | 0.3503 | No | ||
| 23 | GPR83 | 4778 | 7357 | 0.029 | 0.3509 | No | ||
| 24 | SLC35F1 | 20027 | 7472 | 0.027 | 0.3458 | No | ||
| 25 | CHES1 | 21007 11200 | 7601 | 0.025 | 0.3400 | No | ||
| 26 | GPM6B | 9034 | 9173 | 0.007 | 0.2557 | No | ||
| 27 | SIX4 | 5445 | 9876 | -0.001 | 0.2179 | No | ||
| 28 | UBE2E3 | 5816 5815 | 10578 | -0.008 | 0.1805 | No | ||
| 29 | IL17RC | 17328 1108 | 11556 | -0.019 | 0.1287 | No | ||
| 30 | RIMS4 | 14360 | 12057 | -0.026 | 0.1028 | No | ||
| 31 | SLC39A14 | 3517 5611 21762 | 12294 | -0.029 | 0.0913 | No | ||
| 32 | RIMS2 | 4370 | 13613 | -0.054 | 0.0226 | No | ||
| 33 | ARFIP2 | 1226 17702 | 13802 | -0.059 | 0.0149 | No | ||
| 34 | YY1 | 10371 | 14122 | -0.068 | 0.0005 | No | ||
| 35 | ESRRG | 6447 | 14257 | -0.072 | -0.0038 | No | ||
| 36 | ERBB2IP | 3232 12234 | 14613 | -0.087 | -0.0193 | No | ||
| 37 | METAP2 | 12095 3323 7092 | 14796 | -0.096 | -0.0252 | No | ||
| 38 | HAO1 | 14418 | 14935 | -0.106 | -0.0283 | No | ||
| 39 | GFRA2 | 21965 | 15624 | -0.177 | -0.0581 | No | ||
| 40 | BRE | 3640 4226 16879 | 15947 | -0.240 | -0.0655 | No | ||
| 41 | ACVR1 | 4334 | 16280 | -0.327 | -0.0699 | No | ||
| 42 | HDGF | 9082 4846 4845 | 17144 | -0.738 | -0.0861 | No | ||
| 43 | VDP | 16794 | 17375 | -0.920 | -0.0607 | No | ||
| 44 | DCTN5 | 18092 | 17992 | -1.498 | -0.0323 | No | ||
| 45 | NLK | 5179 5178 | 18082 | -1.602 | 0.0288 | No |