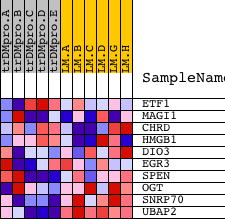
Profile of the Running ES Score & Positions of GeneSet Members on the Rank Ordered List
| Dataset | Set_04_transDMproB_versus_LMproB.phenotype_transDMproB_versus_LMproB.cls #transDMproB_versus_LMproB |
| Phenotype | phenotype_transDMproB_versus_LMproB.cls#transDMproB_versus_LMproB |
| Upregulated in class | LMproB |
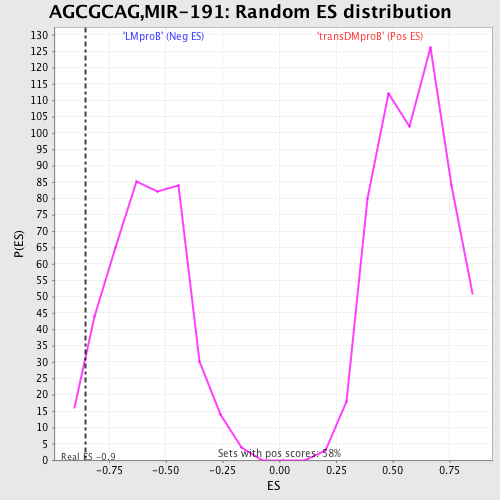
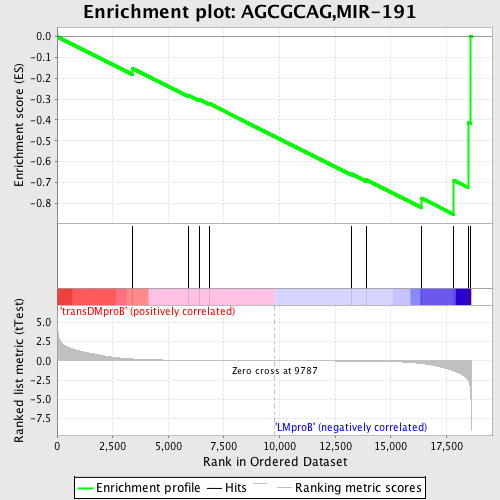
| GeneSet | AGCGCAG,MIR-191 |
| Enrichment Score (ES) | -0.8536983 |
| Normalized Enrichment Score (NES) | -1.4729203 |
| Nominal p-value | 0.04481132 |
| FDR q-value | 0.5751633 |
| FWER p-Value | 0.908 |
| PROBE | DESCRIPTION (from dataset) | GENE SYMBOL | GENE_TITLE | RANK IN GENE LIST | RANK METRIC SCORE | RUNNING ES | CORE ENRICHMENT | |
|---|---|---|---|---|---|---|---|---|
| 1 | ETF1 | 23467 | 3389 | 0.232 | -0.1533 | No | ||
| 2 | MAGI1 | 19828 4816 1179 | 5904 | 0.057 | -0.2814 | No | ||
| 3 | CHRD | 22817 | 6399 | 0.045 | -0.3023 | No | ||
| 4 | HMGB1 | 9094 4855 | 6869 | 0.037 | -0.3230 | No | ||
| 5 | DIO3 | 19359 | 13221 | -0.045 | -0.6587 | No | ||
| 6 | EGR3 | 4656 | 13898 | -0.061 | -0.6875 | No | ||
| 7 | SPEN | 12112 | 16381 | -0.364 | -0.7756 | Yes | ||
| 8 | OGT | 4241 24274 | 17835 | -1.316 | -0.6902 | Yes | ||
| 9 | SNRP70 | 1186 | 18469 | -2.504 | -0.4129 | Yes | ||
| 10 | UBAP2 | 15912 | 18571 | -3.385 | 0.0024 | Yes |