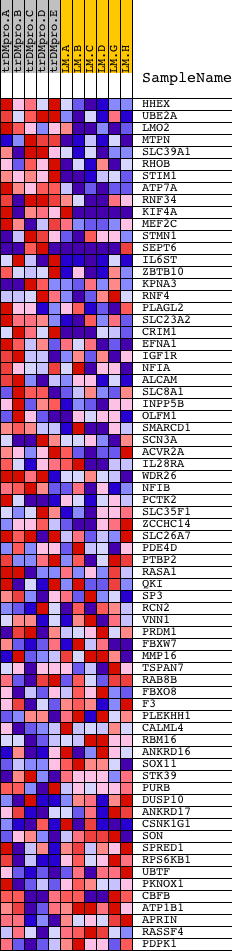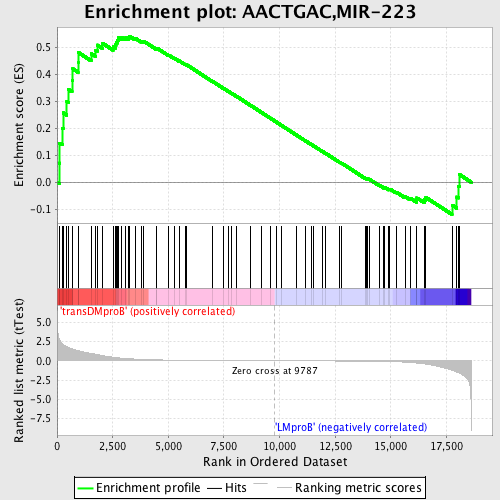
Profile of the Running ES Score & Positions of GeneSet Members on the Rank Ordered List
| Dataset | Set_04_transDMproB_versus_LMproB.phenotype_transDMproB_versus_LMproB.cls #transDMproB_versus_LMproB |
| Phenotype | phenotype_transDMproB_versus_LMproB.cls#transDMproB_versus_LMproB |
| Upregulated in class | transDMproB |
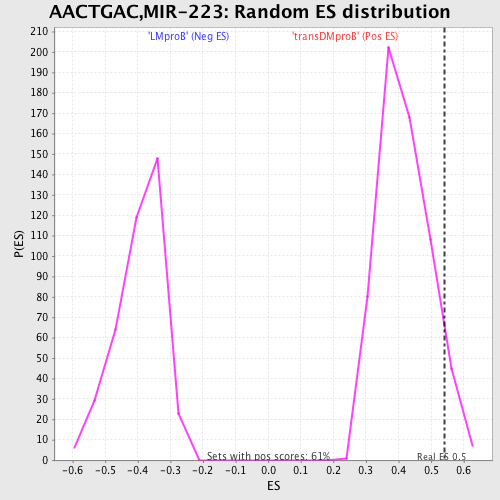
| GeneSet | AACTGAC,MIR-223 |
| Enrichment Score (ES) | 0.54236966 |
| Normalized Enrichment Score (NES) | 1.2994885 |
| Nominal p-value | 0.06710311 |
| FDR q-value | 1.0 |
| FWER p-Value | 1.0 |
| PROBE | DESCRIPTION (from dataset) | GENE SYMBOL | GENE_TITLE | RANK IN GENE LIST | RANK METRIC SCORE | RUNNING ES | CORE ENRICHMENT | |
|---|---|---|---|---|---|---|---|---|
| 1 | HHEX | 23872 | 102 | 2.715 | 0.0715 | Yes | ||
| 2 | UBE2A | 24358 | 116 | 2.617 | 0.1450 | Yes | ||
| 3 | LMO2 | 9281 | 231 | 2.187 | 0.2008 | Yes | ||
| 4 | MTPN | 17183 | 272 | 2.077 | 0.2575 | Yes | ||
| 5 | SLC39A1 | 6625 | 436 | 1.796 | 0.2996 | Yes | ||
| 6 | RHOB | 4411 | 510 | 1.704 | 0.3440 | Yes | ||
| 7 | STIM1 | 18164 | 672 | 1.557 | 0.3795 | Yes | ||
| 8 | ATP7A | 4425 | 707 | 1.526 | 0.4209 | Yes | ||
| 9 | RNF34 | 13479 16710 3637 | 944 | 1.308 | 0.4452 | Yes | ||
| 10 | KIF4A | 9221 24281 | 952 | 1.302 | 0.4818 | Yes | ||
| 11 | MEF2C | 3204 9378 | 1531 | 0.955 | 0.4777 | Yes | ||
| 12 | STMN1 | 9261 | 1734 | 0.837 | 0.4905 | Yes | ||
| 13 | SEPT6 | 2591 7132 | 1804 | 0.799 | 0.5095 | Yes | ||
| 14 | IL6ST | 4920 | 2029 | 0.676 | 0.5165 | Yes | ||
| 15 | ZBTB10 | 10468 | 2515 | 0.464 | 0.5035 | Yes | ||
| 16 | KPNA3 | 21797 | 2621 | 0.424 | 0.5099 | Yes | ||
| 17 | RNF4 | 5385 9729 | 2648 | 0.415 | 0.5202 | Yes | ||
| 18 | PLAGL2 | 7055 | 2716 | 0.387 | 0.5276 | Yes | ||
| 19 | SLC23A2 | 14421 | 2753 | 0.379 | 0.5364 | Yes | ||
| 20 | CRIM1 | 403 | 2903 | 0.338 | 0.5379 | Yes | ||
| 21 | EFNA1 | 15279 | 3088 | 0.288 | 0.5362 | Yes | ||
| 22 | IGF1R | 9157 | 3200 | 0.265 | 0.5377 | Yes | ||
| 23 | NFIA | 16172 5170 | 3250 | 0.257 | 0.5424 | Yes | ||
| 24 | ALCAM | 4367 | 3504 | 0.213 | 0.5348 | No | ||
| 25 | SLC8A1 | 9830 | 3809 | 0.175 | 0.5234 | No | ||
| 26 | INPP5B | 16090 | 3892 | 0.163 | 0.5235 | No | ||
| 27 | OLFM1 | 2918 2971 | 4478 | 0.113 | 0.4952 | No | ||
| 28 | SMARCD1 | 2241 22360 2250 | 4486 | 0.112 | 0.4980 | No | ||
| 29 | SCN3A | 14573 | 5013 | 0.085 | 0.4720 | No | ||
| 30 | ACVR2A | 8542 | 5278 | 0.075 | 0.4599 | No | ||
| 31 | IL28RA | 10823 16038 | 5491 | 0.068 | 0.4504 | No | ||
| 32 | WDR26 | 13733 | 5767 | 0.060 | 0.4373 | No | ||
| 33 | NFIB | 15855 | 5817 | 0.059 | 0.4363 | No | ||
| 34 | PCTK2 | 19907 | 6966 | 0.035 | 0.3754 | No | ||
| 35 | SLC35F1 | 20027 | 7472 | 0.027 | 0.3490 | No | ||
| 36 | ZCCHC14 | 4731 | 7708 | 0.024 | 0.3370 | No | ||
| 37 | SLC26A7 | 5538 2372 | 7828 | 0.022 | 0.3312 | No | ||
| 38 | PDE4D | 10722 6235 | 8049 | 0.019 | 0.3198 | No | ||
| 39 | PTBP2 | 7074 | 8674 | 0.012 | 0.2865 | No | ||
| 40 | RASA1 | 10174 | 9187 | 0.006 | 0.2591 | No | ||
| 41 | QKI | 23128 5340 | 9609 | 0.002 | 0.2365 | No | ||
| 42 | SP3 | 5483 | 9875 | -0.001 | 0.2222 | No | ||
| 43 | RCN2 | 19438 | 10068 | -0.003 | 0.2119 | No | ||
| 44 | VNN1 | 20071 | 10744 | -0.010 | 0.1758 | No | ||
| 45 | PRDM1 | 19775 3337 | 11162 | -0.015 | 0.1538 | No | ||
| 46 | FBXW7 | 1805 11928 | 11412 | -0.018 | 0.1409 | No | ||
| 47 | MMP16 | 5109 | 11545 | -0.019 | 0.1343 | No | ||
| 48 | TSPAN7 | 24382 | 11919 | -0.024 | 0.1149 | No | ||
| 49 | RAB8B | 19072 10653 19073 6170 | 12054 | -0.026 | 0.1084 | No | ||
| 50 | FBXO8 | 18616 3896 | 12700 | -0.035 | 0.0746 | No | ||
| 51 | F3 | 15435 | 12793 | -0.037 | 0.0707 | No | ||
| 52 | PLEKHH1 | 21229 | 13849 | -0.060 | 0.0155 | No | ||
| 53 | CALML4 | 19414 | 13920 | -0.062 | 0.0135 | No | ||
| 54 | RBM16 | 11492 8387 | 13947 | -0.062 | 0.0138 | No | ||
| 55 | ANKRD16 | 6804 | 14048 | -0.065 | 0.0103 | No | ||
| 56 | SOX11 | 5477 | 14475 | -0.081 | -0.0104 | No | ||
| 57 | STK39 | 14570 | 14686 | -0.090 | -0.0192 | No | ||
| 58 | PURB | 5335 | 14734 | -0.092 | -0.0191 | No | ||
| 59 | DUSP10 | 4003 14016 | 14915 | -0.104 | -0.0258 | No | ||
| 60 | ANKRD17 | 13496 3474 8170 | 14960 | -0.107 | -0.0251 | No | ||
| 61 | CSNK1G1 | 3057 5671 19397 | 15235 | -0.130 | -0.0362 | No | ||
| 62 | SON | 5473 1657 1684 | 15648 | -0.181 | -0.0533 | No | ||
| 63 | SPRED1 | 4331 | 15877 | -0.224 | -0.0592 | No | ||
| 64 | RPS6KB1 | 7815 1207 13040 | 16151 | -0.292 | -0.0657 | No | ||
| 65 | UBTF | 1313 10052 | 16171 | -0.296 | -0.0583 | No | ||
| 66 | PKNOX1 | 9578 | 16508 | -0.409 | -0.0648 | No | ||
| 67 | CBFB | 3769 18499 | 16572 | -0.429 | -0.0561 | No | ||
| 68 | ATP1B1 | 4420 | 17752 | -1.235 | -0.0846 | No | ||
| 69 | APRIN | 4145 | 17968 | -1.465 | -0.0547 | No | ||
| 70 | RASSF4 | 10022 1160 5617 | 18040 | -1.565 | -0.0141 | No | ||
| 71 | PDPK1 | 23097 | 18075 | -1.593 | 0.0292 | No |