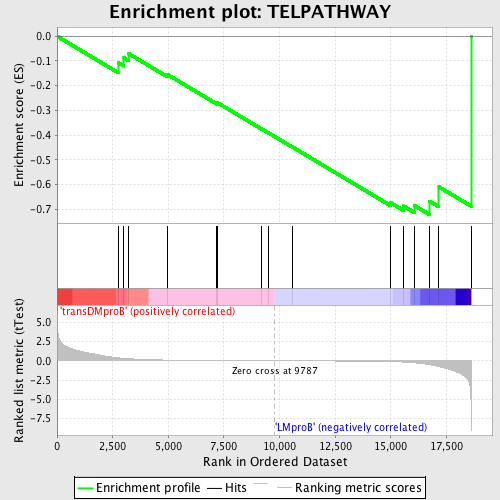
Profile of the Running ES Score & Positions of GeneSet Members on the Rank Ordered List
| Dataset | Set_04_transDMproB_versus_LMproB.phenotype_transDMproB_versus_LMproB.cls #transDMproB_versus_LMproB |
| Phenotype | phenotype_transDMproB_versus_LMproB.cls#transDMproB_versus_LMproB |
| Upregulated in class | LMproB |
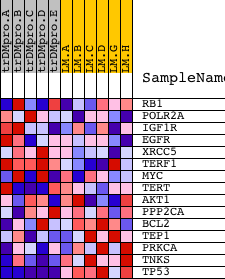
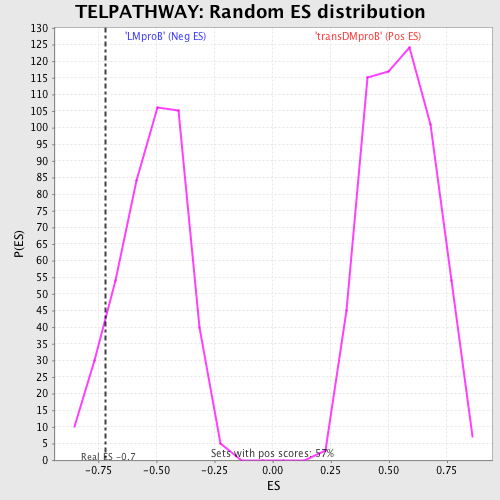
| GeneSet | TELPATHWAY |
| Enrichment Score (ES) | -0.72089636 |
| Normalized Enrichment Score (NES) | -1.381334 |
| Nominal p-value | 0.08986175 |
| FDR q-value | 1.0 |
| FWER p-Value | 1.0 |
| PROBE | DESCRIPTION (from dataset) | GENE SYMBOL | GENE_TITLE | RANK IN GENE LIST | RANK METRIC SCORE | RUNNING ES | CORE ENRICHMENT | |
|---|---|---|---|---|---|---|---|---|
| 1 | RB1 | 21754 | 2742 | 0.381 | -0.1067 | No | ||
| 2 | POLR2A | 5394 | 3001 | 0.310 | -0.0874 | No | ||
| 3 | IGF1R | 9157 | 3200 | 0.265 | -0.0696 | No | ||
| 4 | EGFR | 1329 20944 | 4967 | 0.087 | -0.1553 | No | ||
| 5 | XRCC5 | 14229 | 7184 | 0.032 | -0.2710 | No | ||
| 6 | TERF1 | 14293 | 7215 | 0.031 | -0.2693 | No | ||
| 7 | MYC | 22465 9435 | 9165 | 0.007 | -0.3734 | No | ||
| 8 | TERT | 21604 | 9488 | 0.003 | -0.3903 | No | ||
| 9 | AKT1 | 8568 | 10562 | -0.008 | -0.4471 | No | ||
| 10 | PPP2CA | 20890 | 15002 | -0.111 | -0.6739 | No | ||
| 11 | BCL2 | 8651 3928 13864 4435 981 4062 13863 4027 | 15568 | -0.167 | -0.6864 | Yes | ||
| 12 | TEP1 | 21849 | 16049 | -0.264 | -0.6840 | Yes | ||
| 13 | PRKCA | 20174 | 16737 | -0.507 | -0.6667 | Yes | ||
| 14 | TNKS | 5786 | 17163 | -0.751 | -0.6092 | Yes | ||
| 15 | TP53 | 20822 | 18610 | -6.426 | 0.0003 | Yes |