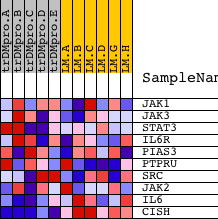
Profile of the Running ES Score & Positions of GeneSet Members on the Rank Ordered List
| Dataset | Set_04_transDMproB_versus_LMproB.phenotype_transDMproB_versus_LMproB.cls #transDMproB_versus_LMproB |
| Phenotype | phenotype_transDMproB_versus_LMproB.cls#transDMproB_versus_LMproB |
| Upregulated in class | LMproB |
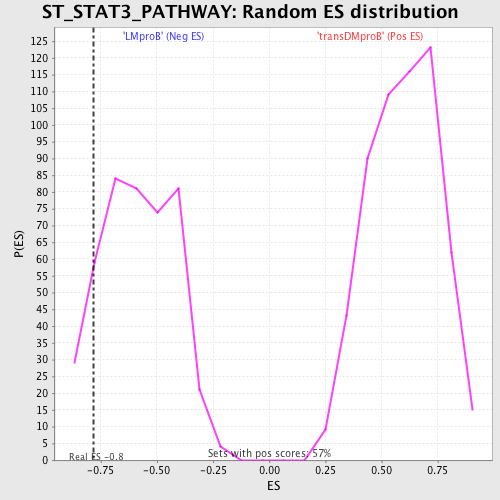
| GeneSet | ST_STAT3_PATHWAY |
| Enrichment Score (ES) | -0.7831916 |
| Normalized Enrichment Score (NES) | -1.3381978 |
| Nominal p-value | 0.11316397 |
| FDR q-value | 1.0 |
| FWER p-Value | 1.0 |
| PROBE | DESCRIPTION (from dataset) | GENE SYMBOL | GENE_TITLE | RANK IN GENE LIST | RANK METRIC SCORE | RUNNING ES | CORE ENRICHMENT | |
|---|---|---|---|---|---|---|---|---|
| 1 | JAK1 | 15827 | 2039 | 0.671 | -0.0191 | No | ||
| 2 | JAK3 | 9198 4936 | 2355 | 0.520 | 0.0340 | No | ||
| 3 | STAT3 | 5525 9906 | 4604 | 0.106 | -0.0726 | No | ||
| 4 | IL6R | 1862 4919 | 5534 | 0.067 | -0.1135 | No | ||
| 5 | PIAS3 | 15491 672 1906 | 5584 | 0.065 | -0.1074 | No | ||
| 6 | PTPRU | 15738 | 5665 | 0.063 | -0.1032 | No | ||
| 7 | SRC | 5507 | 8722 | 0.011 | -0.2659 | No | ||
| 8 | JAK2 | 23893 9197 3706 | 12438 | -0.031 | -0.4614 | No | ||
| 9 | IL6 | 16895 | 14254 | -0.072 | -0.5492 | Yes | ||
| 10 | CISH | 8743 | 18609 | -5.815 | 0.0004 | Yes |