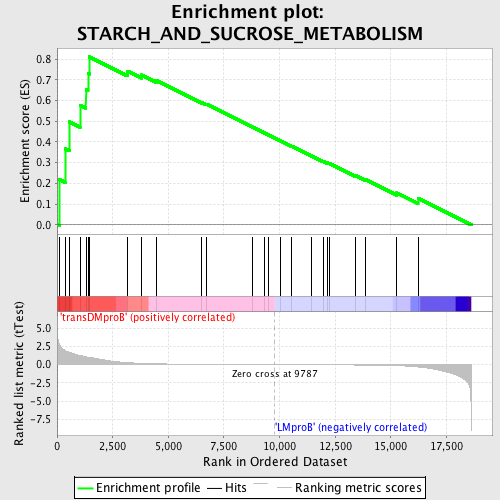
Profile of the Running ES Score & Positions of GeneSet Members on the Rank Ordered List
| Dataset | Set_04_transDMproB_versus_LMproB.phenotype_transDMproB_versus_LMproB.cls #transDMproB_versus_LMproB |
| Phenotype | phenotype_transDMproB_versus_LMproB.cls#transDMproB_versus_LMproB |
| Upregulated in class | transDMproB |
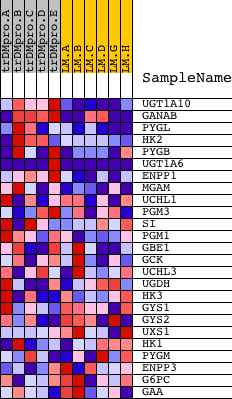
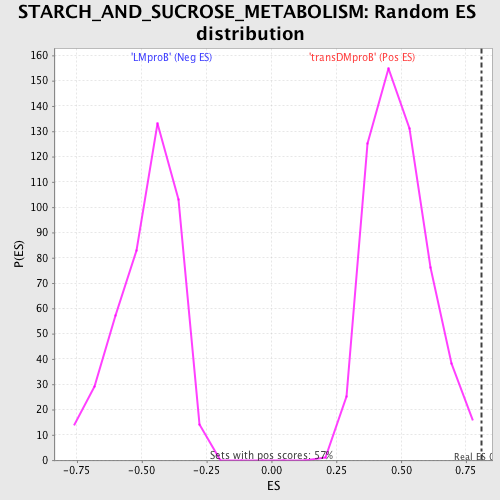
| GeneSet | STARCH_AND_SUCROSE_METABOLISM |
| Enrichment Score (ES) | 0.81056917 |
| Normalized Enrichment Score (NES) | 1.6516435 |
| Nominal p-value | 0.0017636684 |
| FDR q-value | 0.09490548 |
| FWER p-Value | 0.176 |
| PROBE | DESCRIPTION (from dataset) | GENE SYMBOL | GENE_TITLE | RANK IN GENE LIST | RANK METRIC SCORE | RUNNING ES | CORE ENRICHMENT | |
|---|---|---|---|---|---|---|---|---|
| 1 | UGT1A10 | 6908 | 106 | 2.673 | 0.2185 | Yes | ||
| 2 | GANAB | 8992 23937 | 360 | 1.938 | 0.3675 | Yes | ||
| 3 | PYGL | 21046 | 543 | 1.666 | 0.4975 | Yes | ||
| 4 | HK2 | 17106 | 1032 | 1.246 | 0.5759 | Yes | ||
| 5 | PYGB | 14804 | 1298 | 1.067 | 0.6512 | Yes | ||
| 6 | UGT1A6 | 3969 4079 6911 13591 | 1389 | 1.006 | 0.7307 | Yes | ||
| 7 | ENPP1 | 19804 | 1450 | 0.990 | 0.8106 | Yes | ||
| 8 | MGAM | 17476 | 3163 | 0.274 | 0.7415 | No | ||
| 9 | UCHL1 | 16834 | 3784 | 0.179 | 0.7232 | No | ||
| 10 | PGM3 | 19045 | 4455 | 0.114 | 0.6967 | No | ||
| 11 | SI | 19837 3443 | 6502 | 0.043 | 0.5903 | No | ||
| 12 | PGM1 | 16841 | 6702 | 0.039 | 0.5829 | No | ||
| 13 | GBE1 | 13180 | 8790 | 0.011 | 0.4715 | No | ||
| 14 | GCK | 20535 | 9320 | 0.005 | 0.4435 | No | ||
| 15 | UCHL3 | 6956 | 9518 | 0.003 | 0.4332 | No | ||
| 16 | UGDH | 10249 | 10044 | -0.003 | 0.4052 | No | ||
| 17 | HK3 | 3224 477 | 10531 | -0.008 | 0.3797 | No | ||
| 18 | GYS1 | 4818 | 11419 | -0.018 | 0.3335 | No | ||
| 19 | GYS2 | 16941 | 11969 | -0.025 | 0.3061 | No | ||
| 20 | UXS1 | 13965 | 12131 | -0.027 | 0.2997 | No | ||
| 21 | HK1 | 4854 | 12240 | -0.029 | 0.2963 | No | ||
| 22 | PYGM | 23792 | 13433 | -0.049 | 0.2363 | No | ||
| 23 | ENPP3 | 19803 | 13863 | -0.060 | 0.2182 | No | ||
| 24 | G6PC | 20656 | 15271 | -0.133 | 0.1537 | No | ||
| 25 | GAA | 20575 | 16222 | -0.311 | 0.1288 | No |