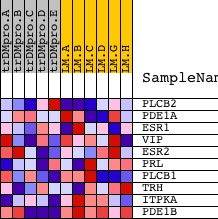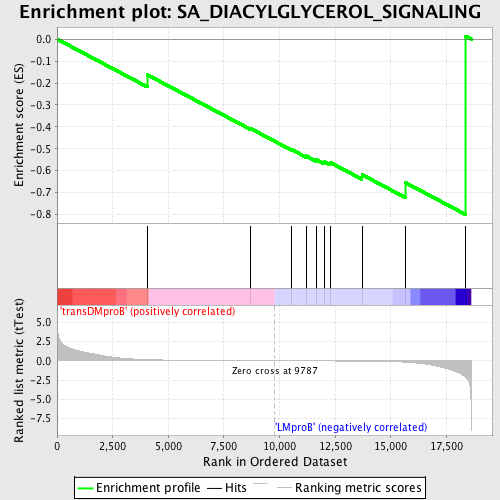
Profile of the Running ES Score & Positions of GeneSet Members on the Rank Ordered List
| Dataset | Set_04_transDMproB_versus_LMproB.phenotype_transDMproB_versus_LMproB.cls #transDMproB_versus_LMproB |
| Phenotype | phenotype_transDMproB_versus_LMproB.cls#transDMproB_versus_LMproB |
| Upregulated in class | LMproB |
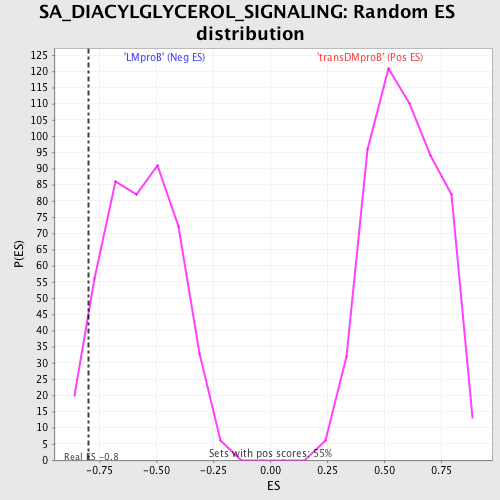
| GeneSet | SA_DIACYLGLYCEROL_SIGNALING |
| Enrichment Score (ES) | -0.79959667 |
| Normalized Enrichment Score (NES) | -1.412846 |
| Nominal p-value | 0.060538117 |
| FDR q-value | 1.0 |
| FWER p-Value | 1.0 |
| PROBE | DESCRIPTION (from dataset) | GENE SYMBOL | GENE_TITLE | RANK IN GENE LIST | RANK METRIC SCORE | RUNNING ES | CORE ENRICHMENT | |
|---|---|---|---|---|---|---|---|---|
| 1 | PLCB2 | 5262 | 4054 | 0.147 | -0.1625 | No | ||
| 2 | PDE1A | 9541 5234 | 8701 | 0.012 | -0.4078 | No | ||
| 3 | ESR1 | 20097 4685 | 10532 | -0.008 | -0.5031 | No | ||
| 4 | VIP | 20096 | 11191 | -0.015 | -0.5327 | No | ||
| 5 | ESR2 | 21038 | 11666 | -0.021 | -0.5502 | No | ||
| 6 | PRL | 21690 | 11998 | -0.025 | -0.5584 | No | ||
| 7 | PLCB1 | 14832 2821 | 12286 | -0.029 | -0.5629 | No | ||
| 8 | TRH | 17064 | 13704 | -0.056 | -0.6179 | No | ||
| 9 | ITPKA | 14898 | 15646 | -0.181 | -0.6538 | Yes | ||
| 10 | PDE1B | 9542 | 18359 | -2.152 | 0.0138 | Yes |