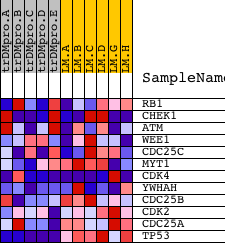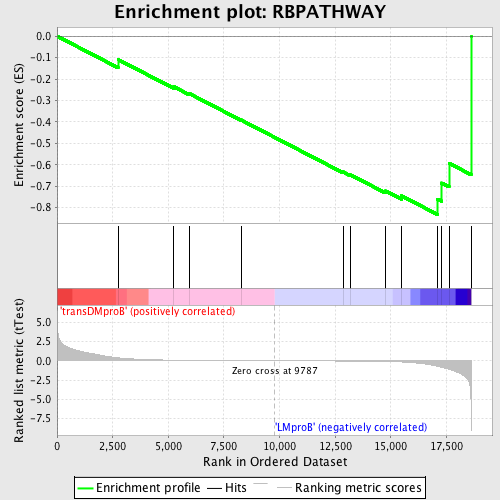
Profile of the Running ES Score & Positions of GeneSet Members on the Rank Ordered List
| Dataset | Set_04_transDMproB_versus_LMproB.phenotype_transDMproB_versus_LMproB.cls #transDMproB_versus_LMproB |
| Phenotype | phenotype_transDMproB_versus_LMproB.cls#transDMproB_versus_LMproB |
| Upregulated in class | LMproB |
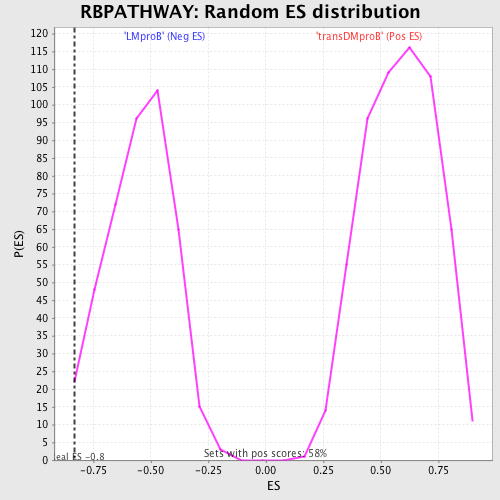
| GeneSet | RBPATHWAY |
| Enrichment Score (ES) | -0.8318648 |
| Normalized Enrichment Score (NES) | -1.5134656 |
| Nominal p-value | 0.018823529 |
| FDR q-value | 1.0 |
| FWER p-Value | 0.984 |
| PROBE | DESCRIPTION (from dataset) | GENE SYMBOL | GENE_TITLE | RANK IN GENE LIST | RANK METRIC SCORE | RUNNING ES | CORE ENRICHMENT | |
|---|---|---|---|---|---|---|---|---|
| 1 | RB1 | 21754 | 2742 | 0.381 | -0.1091 | No | ||
| 2 | CHEK1 | 19181 3085 | 5253 | 0.076 | -0.2364 | No | ||
| 3 | ATM | 2976 19115 | 5932 | 0.056 | -0.2672 | No | ||
| 4 | WEE1 | 18127 | 8265 | 0.017 | -0.3908 | No | ||
| 5 | CDC25C | 23468 1954 1977 | 12850 | -0.038 | -0.6334 | No | ||
| 6 | MYT1 | 36 | 13192 | -0.044 | -0.6473 | No | ||
| 7 | CDK4 | 3424 19859 | 14762 | -0.094 | -0.7221 | No | ||
| 8 | YWHAH | 5937 10368 | 15482 | -0.156 | -0.7451 | No | ||
| 9 | CDC25B | 14841 | 17098 | -0.711 | -0.7603 | Yes | ||
| 10 | CDK2 | 3438 3373 19592 3322 | 17283 | -0.848 | -0.6850 | Yes | ||
| 11 | CDC25A | 8721 | 17619 | -1.092 | -0.5931 | Yes | ||
| 12 | TP53 | 20822 | 18610 | -6.426 | 0.0003 | Yes |