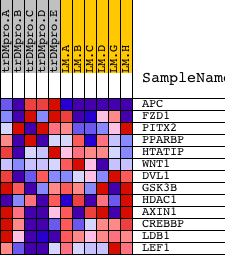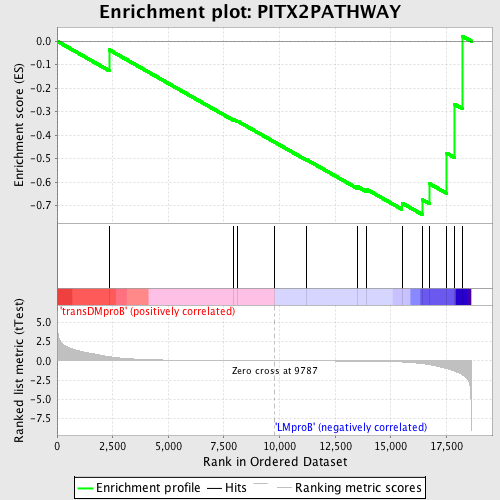
Profile of the Running ES Score & Positions of GeneSet Members on the Rank Ordered List
| Dataset | Set_04_transDMproB_versus_LMproB.phenotype_transDMproB_versus_LMproB.cls #transDMproB_versus_LMproB |
| Phenotype | phenotype_transDMproB_versus_LMproB.cls#transDMproB_versus_LMproB |
| Upregulated in class | LMproB |
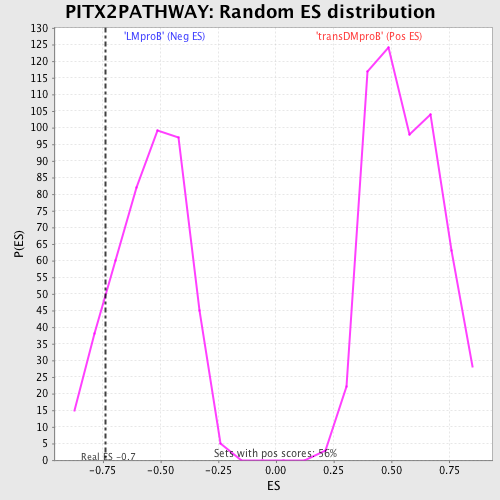
| GeneSet | PITX2PATHWAY |
| Enrichment Score (ES) | -0.73744476 |
| Normalized Enrichment Score (NES) | -1.3439901 |
| Nominal p-value | 0.12244898 |
| FDR q-value | 1.0 |
| FWER p-Value | 1.0 |
| PROBE | DESCRIPTION (from dataset) | GENE SYMBOL | GENE_TITLE | RANK IN GENE LIST | RANK METRIC SCORE | RUNNING ES | CORE ENRICHMENT | |
|---|---|---|---|---|---|---|---|---|
| 1 | APC | 4396 2022 | 2338 | 0.526 | -0.0366 | No | ||
| 2 | FZD1 | 16923 | 7931 | 0.021 | -0.3336 | No | ||
| 3 | PITX2 | 15424 1878 | 8119 | 0.018 | -0.3406 | No | ||
| 4 | PPARBP | 1203 20263 1195 | 9774 | 0.000 | -0.4295 | No | ||
| 5 | HTATIP | 3690 | 11229 | -0.016 | -0.5050 | No | ||
| 6 | WNT1 | 22371 | 13503 | -0.051 | -0.6186 | No | ||
| 7 | DVL1 | 2412 15960 | 13925 | -0.062 | -0.6308 | No | ||
| 8 | GSK3B | 22761 | 15502 | -0.158 | -0.6887 | Yes | ||
| 9 | HDAC1 | 9081 | 16410 | -0.374 | -0.6740 | Yes | ||
| 10 | AXIN1 | 1579 23330 | 16731 | -0.504 | -0.6059 | Yes | ||
| 11 | CREBBP | 22682 8783 | 17516 | -1.011 | -0.4767 | Yes | ||
| 12 | LDB1 | 23654 | 17863 | -1.341 | -0.2681 | Yes | ||
| 13 | LEF1 | 1860 15420 | 18218 | -1.821 | 0.0214 | Yes |