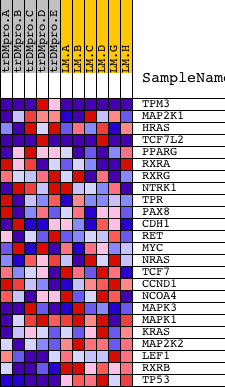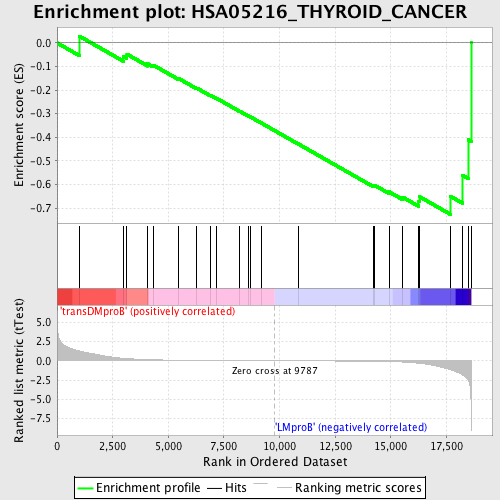
Profile of the Running ES Score & Positions of GeneSet Members on the Rank Ordered List
| Dataset | Set_04_transDMproB_versus_LMproB.phenotype_transDMproB_versus_LMproB.cls #transDMproB_versus_LMproB |
| Phenotype | phenotype_transDMproB_versus_LMproB.cls#transDMproB_versus_LMproB |
| Upregulated in class | LMproB |
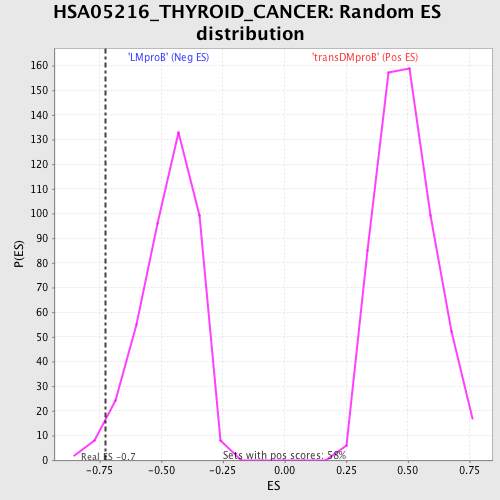
| GeneSet | HSA05216_THYROID_CANCER |
| Enrichment Score (ES) | -0.7271139 |
| Normalized Enrichment Score (NES) | -1.5478519 |
| Nominal p-value | 0.023529412 |
| FDR q-value | 1.0 |
| FWER p-Value | 0.938 |
| PROBE | DESCRIPTION (from dataset) | GENE SYMBOL | GENE_TITLE | RANK IN GENE LIST | RANK METRIC SCORE | RUNNING ES | CORE ENRICHMENT | |
|---|---|---|---|---|---|---|---|---|
| 1 | TPM3 | 12233 7209 7208 1790 | 997 | 1.270 | 0.0289 | No | ||
| 2 | MAP2K1 | 19082 | 2979 | 0.314 | -0.0573 | No | ||
| 3 | HRAS | 4868 | 3138 | 0.279 | -0.0477 | No | ||
| 4 | TCF7L2 | 10048 5646 | 4074 | 0.145 | -0.0885 | No | ||
| 5 | PPARG | 1151 1144 17319 | 4322 | 0.122 | -0.0939 | No | ||
| 6 | RXRA | 9767 | 5468 | 0.069 | -0.1510 | No | ||
| 7 | RXRG | 14063 | 6274 | 0.048 | -0.1912 | No | ||
| 8 | NTRK1 | 15299 | 6874 | 0.037 | -0.2210 | No | ||
| 9 | TPR | 927 4255 | 7160 | 0.032 | -0.2343 | No | ||
| 10 | PAX8 | 2791 14671 | 8197 | 0.017 | -0.2889 | No | ||
| 11 | CDH1 | 18479 | 8599 | 0.013 | -0.3096 | No | ||
| 12 | RET | 17028 | 8711 | 0.012 | -0.3148 | No | ||
| 13 | MYC | 22465 9435 | 9165 | 0.007 | -0.3388 | No | ||
| 14 | NRAS | 5191 | 10835 | -0.011 | -0.4278 | No | ||
| 15 | TCF7 | 1467 20466 | 14232 | -0.071 | -0.6058 | No | ||
| 16 | CCND1 | 4487 4488 8707 17535 | 14255 | -0.072 | -0.6023 | No | ||
| 17 | NCOA4 | 2746 6550 | 14919 | -0.105 | -0.6312 | No | ||
| 18 | MAPK3 | 6458 11170 | 15520 | -0.160 | -0.6530 | No | ||
| 19 | MAPK1 | 1642 11167 | 16258 | -0.321 | -0.6718 | Yes | ||
| 20 | KRAS | 9247 | 16300 | -0.333 | -0.6524 | Yes | ||
| 21 | MAP2K2 | 19933 | 17691 | -1.176 | -0.6507 | Yes | ||
| 22 | LEF1 | 1860 15420 | 18218 | -1.821 | -0.5607 | Yes | ||
| 23 | RXRB | 23285 9768 | 18477 | -2.529 | -0.4102 | Yes | ||
| 24 | TP53 | 20822 | 18610 | -6.426 | 0.0003 | Yes |