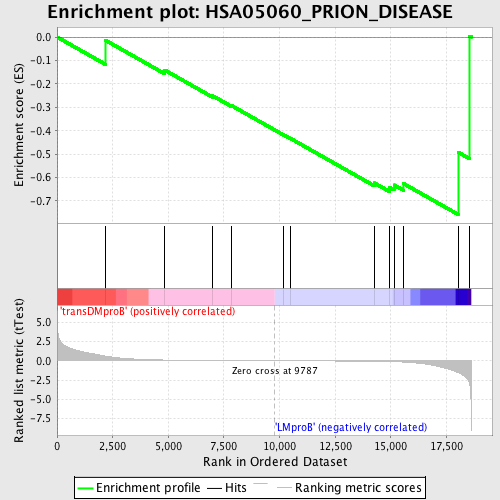
Profile of the Running ES Score & Positions of GeneSet Members on the Rank Ordered List
| Dataset | Set_04_transDMproB_versus_LMproB.phenotype_transDMproB_versus_LMproB.cls #transDMproB_versus_LMproB |
| Phenotype | phenotype_transDMproB_versus_LMproB.cls#transDMproB_versus_LMproB |
| Upregulated in class | LMproB |
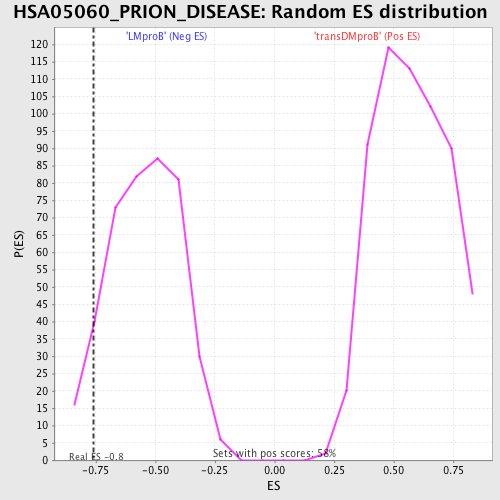
| GeneSet | HSA05060_PRION_DISEASE |
| Enrichment Score (ES) | -0.7575868 |
| Normalized Enrichment Score (NES) | -1.3927109 |
| Nominal p-value | 0.07951807 |
| FDR q-value | 1.0 |
| FWER p-Value | 1.0 |
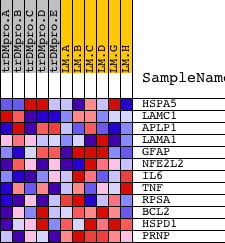
| PROBE | DESCRIPTION (from dataset) | GENE SYMBOL | GENE_TITLE | RANK IN GENE LIST | RANK METRIC SCORE | RUNNING ES | CORE ENRICHMENT | |
|---|---|---|---|---|---|---|---|---|
| 1 | HSPA5 | 9045 | 2171 | 0.600 | -0.0137 | No | ||
| 2 | LAMC1 | 13805 | 4841 | 0.092 | -0.1413 | No | ||
| 3 | APLP1 | 17890 | 6989 | 0.035 | -0.2508 | No | ||
| 4 | LAMA1 | 23168 | 7845 | 0.022 | -0.2930 | No | ||
| 5 | GFAP | 4774 | 10153 | -0.004 | -0.4162 | No | ||
| 6 | NFE2L2 | 2898 14557 | 10484 | -0.008 | -0.4327 | No | ||
| 7 | IL6 | 16895 | 14254 | -0.072 | -0.6229 | No | ||
| 8 | TNF | 23004 | 14940 | -0.106 | -0.6415 | Yes | ||
| 9 | RPSA | 19270 4984 | 15148 | -0.122 | -0.6316 | Yes | ||
| 10 | BCL2 | 8651 3928 13864 4435 981 4062 13863 4027 | 15568 | -0.167 | -0.6255 | Yes | ||
| 11 | HSPD1 | 4078 9129 | 18026 | -1.548 | -0.4919 | Yes | ||
| 12 | PRNP | 9622 | 18542 | -3.052 | 0.0040 | Yes |