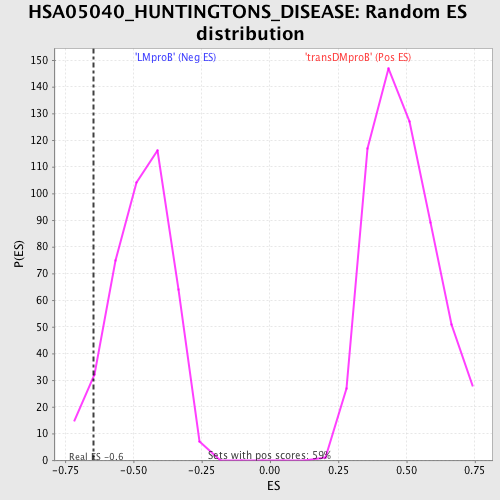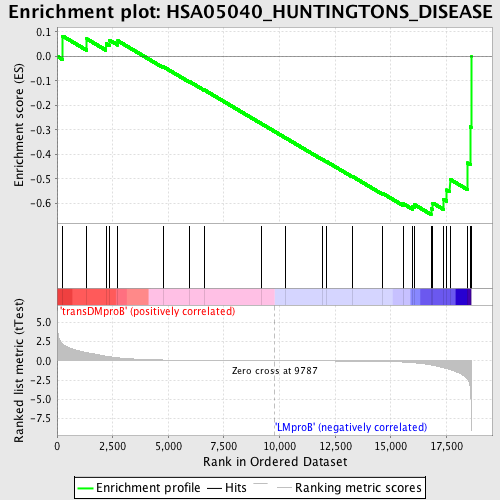
Profile of the Running ES Score & Positions of GeneSet Members on the Rank Ordered List
| Dataset | Set_04_transDMproB_versus_LMproB.phenotype_transDMproB_versus_LMproB.cls #transDMproB_versus_LMproB |
| Phenotype | phenotype_transDMproB_versus_LMproB.cls#transDMproB_versus_LMproB |
| Upregulated in class | LMproB |
| GeneSet | HSA05040_HUNTINGTONS_DISEASE |
| Enrichment Score (ES) | -0.64513177 |
| Normalized Enrichment Score (NES) | -1.3652307 |
| Nominal p-value | 0.06053269 |
| FDR q-value | 1.0 |
| FWER p-Value | 1.0 |
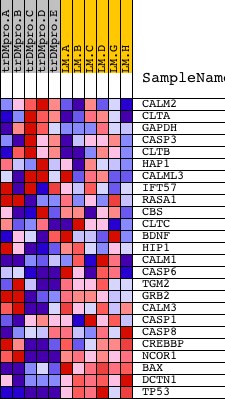
| PROBE | DESCRIPTION (from dataset) | GENE SYMBOL | GENE_TITLE | RANK IN GENE LIST | RANK METRIC SCORE | RUNNING ES | CORE ENRICHMENT | |
|---|---|---|---|---|---|---|---|---|
| 1 | CALM2 | 8681 | 254 | 2.125 | 0.0822 | No | ||
| 2 | CLTA | 8750 | 1334 | 1.037 | 0.0710 | No | ||
| 3 | GAPDH | 348 348 9002 | 2197 | 0.587 | 0.0511 | No | ||
| 4 | CASP3 | 8693 | 2366 | 0.515 | 0.0653 | No | ||
| 5 | CLTB | 21458 | 2731 | 0.383 | 0.0630 | No | ||
| 6 | HAP1 | 1297 20231 1231 | 4766 | 0.096 | -0.0420 | No | ||
| 7 | CALML3 | 21553 | 5962 | 0.055 | -0.1038 | No | ||
| 8 | IFT57 | 13144 22737 7876 | 6609 | 0.041 | -0.1367 | No | ||
| 9 | RASA1 | 10174 | 9187 | 0.006 | -0.2750 | No | ||
| 10 | CBS | 1550 23034 | 10255 | -0.005 | -0.3322 | No | ||
| 11 | CLTC | 14610 | 11927 | -0.024 | -0.4210 | No | ||
| 12 | BDNF | 14926 2797 | 12118 | -0.027 | -0.4300 | No | ||
| 13 | HIP1 | 5676 | 13259 | -0.046 | -0.4892 | No | ||
| 14 | CALM1 | 21184 | 14645 | -0.088 | -0.5598 | No | ||
| 15 | CASP6 | 15422 1885 | 15569 | -0.167 | -0.6019 | No | ||
| 16 | TGM2 | 2657 | 15985 | -0.248 | -0.6130 | No | ||
| 17 | GRB2 | 20149 | 16071 | -0.270 | -0.6054 | No | ||
| 18 | CALM3 | 8682 | 16811 | -0.540 | -0.6207 | Yes | ||
| 19 | CASP1 | 19577 | 16884 | -0.579 | -0.5985 | Yes | ||
| 20 | CASP8 | 8694 | 17378 | -0.922 | -0.5834 | Yes | ||
| 21 | CREBBP | 22682 8783 | 17516 | -1.011 | -0.5451 | Yes | ||
| 22 | NCOR1 | 5402 | 17659 | -1.136 | -0.5015 | Yes | ||
| 23 | BAX | 17832 | 18451 | -2.419 | -0.4349 | Yes | ||
| 24 | DCTN1 | 1100 17392 | 18572 | -3.406 | -0.2877 | Yes | ||
| 25 | TP53 | 20822 | 18610 | -6.426 | 0.0003 | Yes |