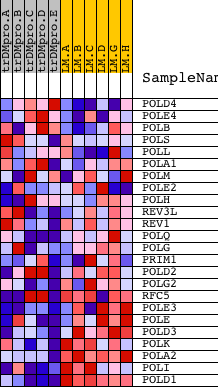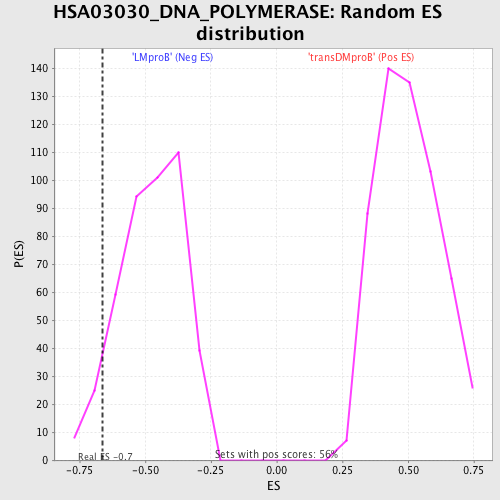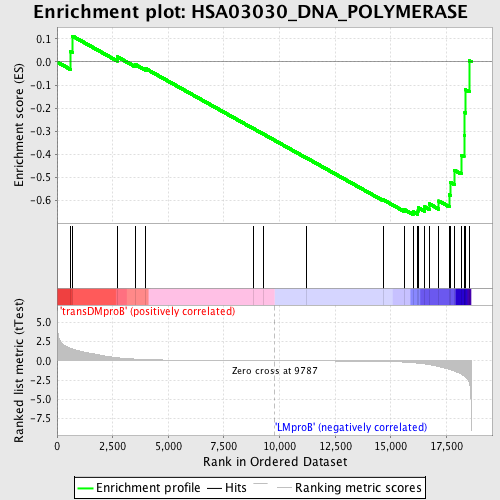
Profile of the Running ES Score & Positions of GeneSet Members on the Rank Ordered List
| Dataset | Set_04_transDMproB_versus_LMproB.phenotype_transDMproB_versus_LMproB.cls #transDMproB_versus_LMproB |
| Phenotype | phenotype_transDMproB_versus_LMproB.cls#transDMproB_versus_LMproB |
| Upregulated in class | LMproB |
| GeneSet | HSA03030_DNA_POLYMERASE |
| Enrichment Score (ES) | -0.6608807 |
| Normalized Enrichment Score (NES) | -1.3849586 |
| Nominal p-value | 0.07110092 |
| FDR q-value | 1.0 |
| FWER p-Value | 1.0 |
| PROBE | DESCRIPTION (from dataset) | GENE SYMBOL | GENE_TITLE | RANK IN GENE LIST | RANK METRIC SCORE | RUNNING ES | CORE ENRICHMENT | |
|---|---|---|---|---|---|---|---|---|
| 1 | POLD4 | 12822 | 609 | 1.619 | 0.0440 | No | ||
| 2 | POLE4 | 12441 | 695 | 1.533 | 0.1121 | No | ||
| 3 | POLB | 9599 | 2706 | 0.391 | 0.0225 | No | ||
| 4 | POLS | 9963 | 3520 | 0.211 | -0.0112 | No | ||
| 5 | POLL | 23658 3688 | 3978 | 0.153 | -0.0285 | No | ||
| 6 | POLA1 | 24112 | 8845 | 0.010 | -0.2897 | No | ||
| 7 | POLM | 20538 | 9269 | 0.006 | -0.3122 | No | ||
| 8 | POLE2 | 21053 | 11189 | -0.015 | -0.4147 | No | ||
| 9 | POLH | 22966 | 14657 | -0.089 | -0.5969 | No | ||
| 10 | REV3L | 20050 | 15621 | -0.176 | -0.6404 | No | ||
| 11 | REV1 | 13971 | 16003 | -0.253 | -0.6489 | Yes | ||
| 12 | POLQ | 13407 22768 | 16219 | -0.310 | -0.6458 | Yes | ||
| 13 | POLG | 17789 | 16225 | -0.312 | -0.6313 | Yes | ||
| 14 | PRIM1 | 19847 | 16527 | -0.414 | -0.6278 | Yes | ||
| 15 | POLD2 | 20537 | 16730 | -0.503 | -0.6148 | Yes | ||
| 16 | POLG2 | 20180 | 17158 | -0.748 | -0.6024 | Yes | ||
| 17 | RFC5 | 13005 7791 | 17631 | -1.099 | -0.5756 | Yes | ||
| 18 | POLE3 | 7200 | 17688 | -1.175 | -0.5229 | Yes | ||
| 19 | POLE | 16755 | 17862 | -1.338 | -0.4688 | Yes | ||
| 20 | POLD3 | 17742 | 18165 | -1.717 | -0.4036 | Yes | ||
| 21 | POLK | 21384 | 18292 | -1.976 | -0.3166 | Yes | ||
| 22 | POLA2 | 23988 | 18327 | -2.076 | -0.2200 | Yes | ||
| 23 | POLI | 23410 | 18352 | -2.136 | -0.1200 | Yes | ||
| 24 | POLD1 | 17847 | 18525 | -2.830 | 0.0049 | Yes |