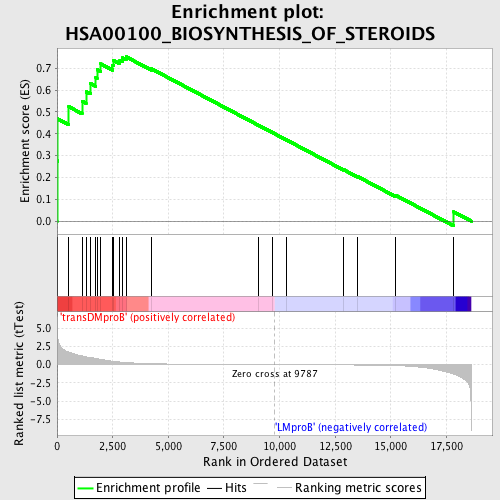
Profile of the Running ES Score & Positions of GeneSet Members on the Rank Ordered List
| Dataset | Set_04_transDMproB_versus_LMproB.phenotype_transDMproB_versus_LMproB.cls #transDMproB_versus_LMproB |
| Phenotype | phenotype_transDMproB_versus_LMproB.cls#transDMproB_versus_LMproB |
| Upregulated in class | transDMproB |
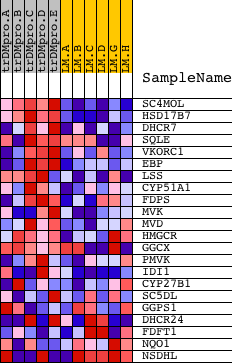
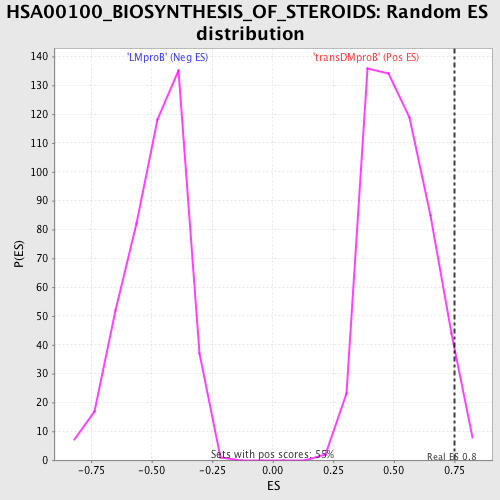
| GeneSet | HSA00100_BIOSYNTHESIS_OF_STEROIDS |
| Enrichment Score (ES) | 0.75183016 |
| Normalized Enrichment Score (NES) | 1.4521925 |
| Nominal p-value | 0.029038113 |
| FDR q-value | 0.3977659 |
| FWER p-Value | 0.999 |
| PROBE | DESCRIPTION (from dataset) | GENE SYMBOL | GENE_TITLE | RANK IN GENE LIST | RANK METRIC SCORE | RUNNING ES | CORE ENRICHMENT | |
|---|---|---|---|---|---|---|---|---|
| 1 | SC4MOL | 18867 | 3 | 5.625 | 0.2756 | Yes | ||
| 2 | HSD17B7 | 13768 | 22 | 3.944 | 0.4681 | Yes | ||
| 3 | DHCR7 | 17999 | 527 | 1.684 | 0.5235 | Yes | ||
| 4 | SQLE | 22468 2229 | 1123 | 1.183 | 0.5495 | Yes | ||
| 5 | VKORC1 | 17607 2126 | 1303 | 1.065 | 0.5921 | Yes | ||
| 6 | EBP | 24191 | 1493 | 0.974 | 0.6297 | Yes | ||
| 7 | LSS | 5006 | 1740 | 0.834 | 0.6574 | Yes | ||
| 8 | CYP51A1 | 4592 | 1797 | 0.803 | 0.6937 | Yes | ||
| 9 | FDPS | 8474 | 1964 | 0.709 | 0.7196 | Yes | ||
| 10 | MVK | 16741 | 2493 | 0.473 | 0.7144 | Yes | ||
| 11 | MVD | 18721 | 2523 | 0.458 | 0.7353 | Yes | ||
| 12 | HMGCR | 9097 | 2819 | 0.359 | 0.7370 | Yes | ||
| 13 | GGCX | 17412 992 | 2932 | 0.329 | 0.7471 | Yes | ||
| 14 | PMVK | 15539 | 3104 | 0.285 | 0.7518 | Yes | ||
| 15 | IDI1 | 11452 | 4243 | 0.128 | 0.6969 | No | ||
| 16 | CYP27B1 | 8831 3426 | 9045 | 0.008 | 0.4391 | No | ||
| 17 | SC5DL | 6165 | 9677 | 0.001 | 0.4053 | No | ||
| 18 | GGPS1 | 3194 4776 | 10304 | -0.006 | 0.3719 | No | ||
| 19 | DHCR24 | 13228 7932 16159 | 12879 | -0.039 | 0.2353 | No | ||
| 20 | FDFT1 | 21793 | 13504 | -0.051 | 0.2043 | No | ||
| 21 | NQO1 | 18754 3836 | 15198 | -0.127 | 0.1194 | No | ||
| 22 | NSDHL | 9489 9488 5198 | 17830 | -1.312 | 0.0423 | No |