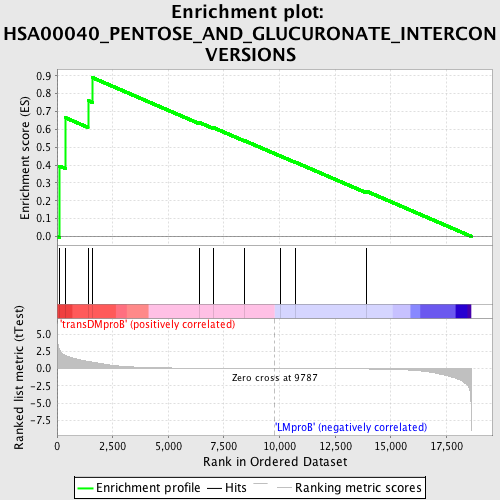
Profile of the Running ES Score & Positions of GeneSet Members on the Rank Ordered List
| Dataset | Set_04_transDMproB_versus_LMproB.phenotype_transDMproB_versus_LMproB.cls #transDMproB_versus_LMproB |
| Phenotype | phenotype_transDMproB_versus_LMproB.cls#transDMproB_versus_LMproB |
| Upregulated in class | transDMproB |
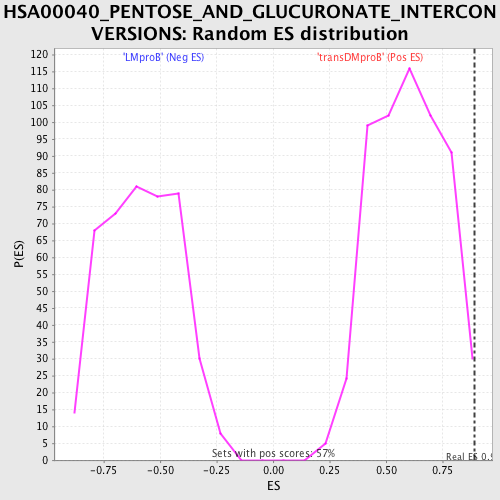
| GeneSet | HSA00040_PENTOSE_AND_GLUCURONATE_INTERCONVERSIONS |
| Enrichment Score (ES) | 0.889898 |
| Normalized Enrichment Score (NES) | 1.4842346 |
| Nominal p-value | 0.010544815 |
| FDR q-value | 0.3386475 |
| FWER p-Value | 0.996 |
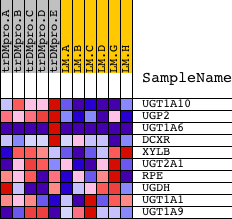
| PROBE | DESCRIPTION (from dataset) | GENE SYMBOL | GENE_TITLE | RANK IN GENE LIST | RANK METRIC SCORE | RUNNING ES | CORE ENRICHMENT | |
|---|---|---|---|---|---|---|---|---|
| 1 | UGT1A10 | 6908 | 106 | 2.673 | 0.3946 | Yes | ||
| 2 | UGP2 | 20518 | 377 | 1.901 | 0.6649 | Yes | ||
| 3 | UGT1A6 | 3969 4079 6911 13591 | 1389 | 1.006 | 0.7613 | Yes | ||
| 4 | DCXR | 20108 | 1584 | 0.928 | 0.8899 | Yes | ||
| 5 | XYLB | 19277 | 6401 | 0.045 | 0.6378 | No | ||
| 6 | UGT2A1 | 8247 | 7012 | 0.034 | 0.6102 | No | ||
| 7 | RPE | 14232 | 8423 | 0.015 | 0.5366 | No | ||
| 8 | UGDH | 10249 | 10044 | -0.003 | 0.4500 | No | ||
| 9 | UGT1A1 | 11851 | 10711 | -0.010 | 0.4157 | No | ||
| 10 | UGT1A9 | 11849 11850 | 13890 | -0.061 | 0.2540 | No |