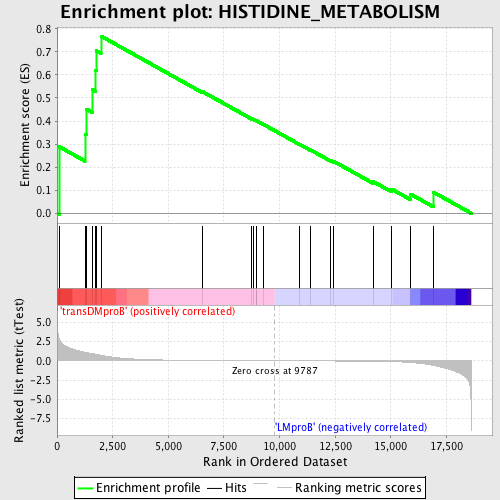
Profile of the Running ES Score & Positions of GeneSet Members on the Rank Ordered List
| Dataset | Set_04_transDMproB_versus_LMproB.phenotype_transDMproB_versus_LMproB.cls #transDMproB_versus_LMproB |
| Phenotype | phenotype_transDMproB_versus_LMproB.cls#transDMproB_versus_LMproB |
| Upregulated in class | transDMproB |
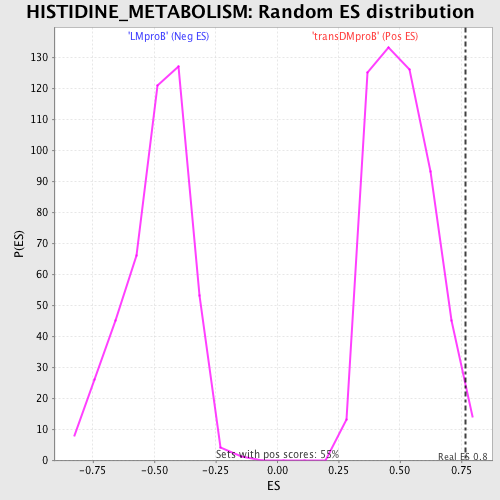
| GeneSet | HISTIDINE_METABOLISM |
| Enrichment Score (ES) | 0.76811504 |
| Normalized Enrichment Score (NES) | 1.5146148 |
| Nominal p-value | 0.009107468 |
| FDR q-value | 0.37900248 |
| FWER p-Value | 0.951 |
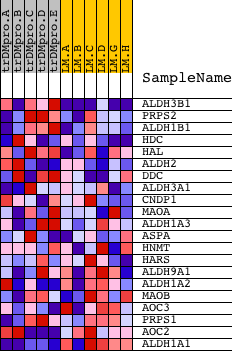
| PROBE | DESCRIPTION (from dataset) | GENE SYMBOL | GENE_TITLE | RANK IN GENE LIST | RANK METRIC SCORE | RUNNING ES | CORE ENRICHMENT | |
|---|---|---|---|---|---|---|---|---|
| 1 | ALDH3B1 | 12569 23949 | 97 | 2.759 | 0.2885 | Yes | ||
| 2 | PRPS2 | 24003 | 1254 | 1.096 | 0.3429 | Yes | ||
| 3 | ALDH1B1 | 16219 | 1313 | 1.055 | 0.4521 | Yes | ||
| 4 | HDC | 14447 | 1586 | 0.927 | 0.5362 | Yes | ||
| 5 | HAL | 19905 | 1727 | 0.845 | 0.6186 | Yes | ||
| 6 | ALDH2 | 16384 | 1758 | 0.825 | 0.7048 | Yes | ||
| 7 | DDC | 4605 | 1974 | 0.703 | 0.7681 | Yes | ||
| 8 | ALDH3A1 | 20854 | 6528 | 0.043 | 0.5278 | No | ||
| 9 | CNDP1 | 23396 | 8758 | 0.011 | 0.4091 | No | ||
| 10 | MAOA | 9368 24374 | 8812 | 0.011 | 0.4074 | No | ||
| 11 | ALDH1A3 | 17802 | 8953 | 0.009 | 0.4009 | No | ||
| 12 | ASPA | 20354 | 8954 | 0.009 | 0.4018 | No | ||
| 13 | HNMT | 14672 | 9255 | 0.006 | 0.3863 | No | ||
| 14 | HARS | 23451 | 10907 | -0.012 | 0.2988 | No | ||
| 15 | ALDH9A1 | 14064 | 11384 | -0.017 | 0.2750 | No | ||
| 16 | ALDH1A2 | 19386 | 12289 | -0.029 | 0.2295 | No | ||
| 17 | MAOB | 24182 2556 | 12439 | -0.031 | 0.2248 | No | ||
| 18 | AOC3 | 8595 | 14213 | -0.071 | 0.1370 | No | ||
| 19 | PRPS1 | 24233 | 15031 | -0.113 | 0.1051 | No | ||
| 20 | AOC2 | 20658 1256 | 15888 | -0.225 | 0.0830 | No | ||
| 21 | ALDH1A1 | 8569 | 16926 | -0.598 | 0.0909 | No |