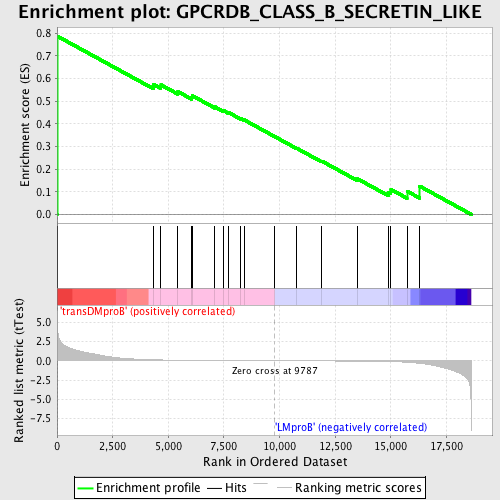
Profile of the Running ES Score & Positions of GeneSet Members on the Rank Ordered List
| Dataset | Set_04_transDMproB_versus_LMproB.phenotype_transDMproB_versus_LMproB.cls #transDMproB_versus_LMproB |
| Phenotype | phenotype_transDMproB_versus_LMproB.cls#transDMproB_versus_LMproB |
| Upregulated in class | transDMproB |
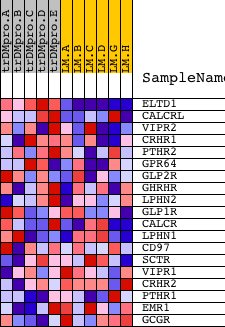
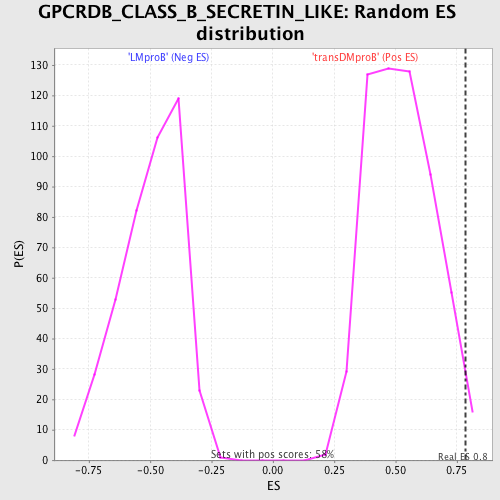
| GeneSet | GPCRDB_CLASS_B_SECRETIN_LIKE |
| Enrichment Score (ES) | 0.7870439 |
| Normalized Enrichment Score (NES) | 1.5031815 |
| Nominal p-value | 0.018965518 |
| FDR q-value | 0.30044362 |
| FWER p-Value | 0.977 |
| PROBE | DESCRIPTION (from dataset) | GENE SYMBOL | GENE_TITLE | RANK IN GENE LIST | RANK METRIC SCORE | RUNNING ES | CORE ENRICHMENT | |
|---|---|---|---|---|---|---|---|---|
| 1 | ELTD1 | 15391 | 5 | 4.972 | 0.7870 | Yes | ||
| 2 | CALCRL | 12041 | 4327 | 0.121 | 0.5739 | No | ||
| 3 | VIPR2 | 21125 | 4668 | 0.102 | 0.5718 | No | ||
| 4 | CRHR1 | 1464 1468 20633 | 5427 | 0.070 | 0.5422 | No | ||
| 5 | PTHR2 | 10032 | 6051 | 0.053 | 0.5171 | No | ||
| 6 | GPR64 | 24217 2644 | 6082 | 0.052 | 0.5237 | No | ||
| 7 | GLP2R | 8227 13563 13564 | 7095 | 0.033 | 0.4746 | No | ||
| 8 | GHRHR | 1007 17436 | 7492 | 0.027 | 0.4575 | No | ||
| 9 | LPHN2 | 13619 | 7685 | 0.024 | 0.4510 | No | ||
| 10 | GLP1R | 23304 | 8259 | 0.017 | 0.4228 | No | ||
| 11 | CALCR | 17229 | 8403 | 0.015 | 0.4175 | No | ||
| 12 | LPHN1 | 6850 174 | 9770 | 0.000 | 0.3441 | No | ||
| 13 | CD97 | 18822 3874 | 10781 | -0.011 | 0.2915 | No | ||
| 14 | SCTR | 14157 | 11894 | -0.024 | 0.2355 | No | ||
| 15 | VIPR1 | 3048 19264 3012 | 13506 | -0.051 | 0.1569 | No | ||
| 16 | CRHR2 | 17140 | 14894 | -0.102 | 0.0985 | No | ||
| 17 | PTHR1 | 5318 18985 | 15004 | -0.111 | 0.1103 | No | ||
| 18 | EMR1 | 1506 23172 | 15730 | -0.197 | 0.1025 | No | ||
| 19 | GCGR | 20566 | 16299 | -0.333 | 0.1246 | No |