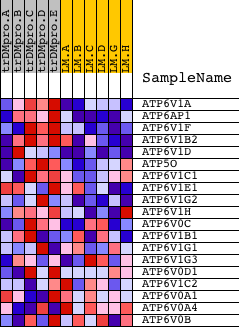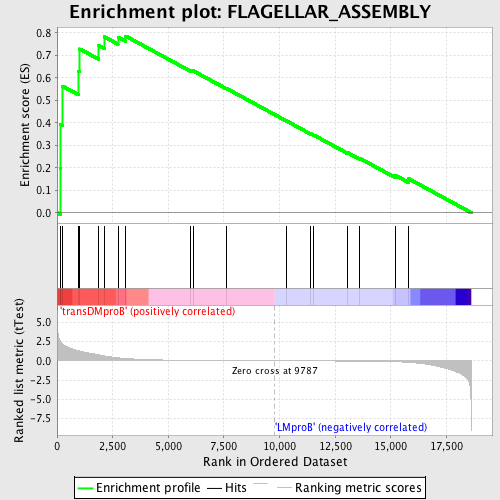
Profile of the Running ES Score & Positions of GeneSet Members on the Rank Ordered List
| Dataset | Set_04_transDMproB_versus_LMproB.phenotype_transDMproB_versus_LMproB.cls #transDMproB_versus_LMproB |
| Phenotype | phenotype_transDMproB_versus_LMproB.cls#transDMproB_versus_LMproB |
| Upregulated in class | transDMproB |
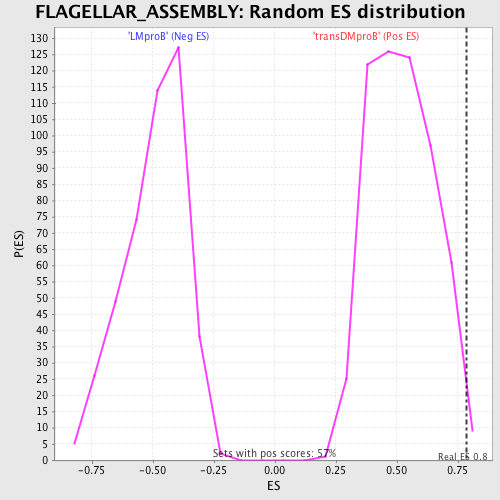
| GeneSet | FLAGELLAR_ASSEMBLY |
| Enrichment Score (ES) | 0.78522515 |
| Normalized Enrichment Score (NES) | 1.5055889 |
| Nominal p-value | 0.010619469 |
| FDR q-value | 0.3178797 |
| FWER p-Value | 0.971 |
| PROBE | DESCRIPTION (from dataset) | GENE SYMBOL | GENE_TITLE | RANK IN GENE LIST | RANK METRIC SCORE | RUNNING ES | CORE ENRICHMENT | |
|---|---|---|---|---|---|---|---|---|
| 1 | ATP6V1A | 8638 | 142 | 2.504 | 0.1964 | Yes | ||
| 2 | ATP6AP1 | 24296 | 162 | 2.422 | 0.3927 | Yes | ||
| 3 | ATP6V1F | 12291 | 250 | 2.140 | 0.5624 | Yes | ||
| 4 | ATP6V1B2 | 18599 | 973 | 1.288 | 0.6286 | Yes | ||
| 5 | ATP6V1D | 7872 | 1021 | 1.251 | 0.7280 | Yes | ||
| 6 | ATP5O | 22539 | 1878 | 0.758 | 0.7437 | Yes | ||
| 7 | ATP6V1C1 | 22487 12329 | 2121 | 0.634 | 0.7823 | Yes | ||
| 8 | ATP6V1E1 | 4423 | 2737 | 0.382 | 0.7804 | Yes | ||
| 9 | ATP6V1G2 | 23257 1534 | 3086 | 0.289 | 0.7852 | Yes | ||
| 10 | ATP6V1H | 14301 | 5973 | 0.055 | 0.6345 | No | ||
| 11 | ATP6V0C | 8643 | 6122 | 0.051 | 0.6307 | No | ||
| 12 | ATP6V1B1 | 8499 | 7591 | 0.025 | 0.5539 | No | ||
| 13 | ATP6V1G1 | 12322 | 10294 | -0.006 | 0.4090 | No | ||
| 14 | ATP6V1G3 | 14107 | 11399 | -0.018 | 0.3511 | No | ||
| 15 | ATP6V0D1 | 3895 8639 3920 | 11540 | -0.019 | 0.3451 | No | ||
| 16 | ATP6V1C2 | 21098 | 13050 | -0.042 | 0.2674 | No | ||
| 17 | ATP6V0A1 | 8640 4424 1197 | 13586 | -0.053 | 0.2430 | No | ||
| 18 | ATP6V0A4 | 8934 | 15216 | -0.128 | 0.1658 | No | ||
| 19 | ATP6V0B | 15786 | 15794 | -0.208 | 0.1517 | No |