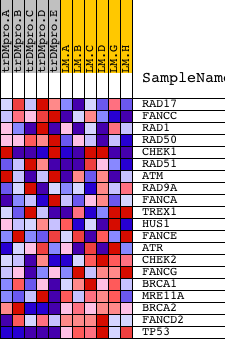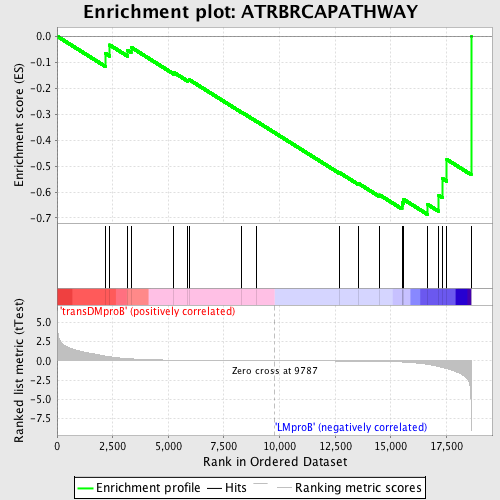
Profile of the Running ES Score & Positions of GeneSet Members on the Rank Ordered List
| Dataset | Set_04_transDMproB_versus_LMproB.phenotype_transDMproB_versus_LMproB.cls #transDMproB_versus_LMproB |
| Phenotype | phenotype_transDMproB_versus_LMproB.cls#transDMproB_versus_LMproB |
| Upregulated in class | LMproB |
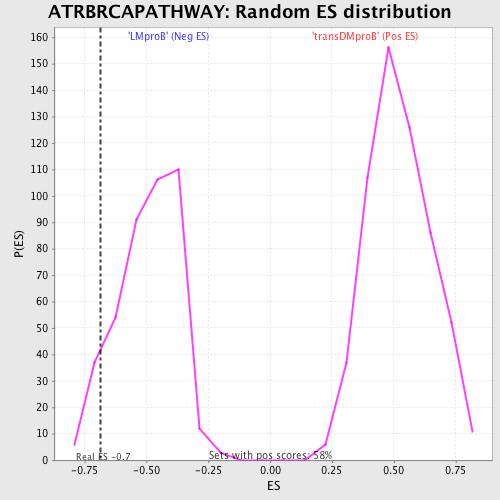
| GeneSet | ATRBRCAPATHWAY |
| Enrichment Score (ES) | -0.68647903 |
| Normalized Enrichment Score (NES) | -1.395729 |
| Nominal p-value | 0.071599044 |
| FDR q-value | 1.0 |
| FWER p-Value | 1.0 |
| PROBE | DESCRIPTION (from dataset) | GENE SYMBOL | GENE_TITLE | RANK IN GENE LIST | RANK METRIC SCORE | RUNNING ES | CORE ENRICHMENT | |
|---|---|---|---|---|---|---|---|---|
| 1 | RAD17 | 21366 | 2165 | 0.607 | -0.0661 | No | ||
| 2 | FANCC | 4712 | 2363 | 0.516 | -0.0338 | No | ||
| 3 | RAD1 | 22507 | 3168 | 0.273 | -0.0544 | No | ||
| 4 | RAD50 | 1198 20460 | 3326 | 0.242 | -0.0427 | No | ||
| 5 | CHEK1 | 19181 3085 | 5253 | 0.076 | -0.1400 | No | ||
| 6 | RAD51 | 2897 14903 | 5880 | 0.057 | -0.1689 | No | ||
| 7 | ATM | 2976 19115 | 5932 | 0.056 | -0.1670 | No | ||
| 8 | RAD9A | 913 3674 910 23958 | 8309 | 0.016 | -0.2934 | No | ||
| 9 | FANCA | 18717 | 8976 | 0.009 | -0.3285 | No | ||
| 10 | TREX1 | 10219 3111 | 12675 | -0.035 | -0.5244 | No | ||
| 11 | HUS1 | 9138 4890 | 13547 | -0.052 | -0.5670 | No | ||
| 12 | FANCE | 23318 | 14500 | -0.082 | -0.6114 | No | ||
| 13 | ATR | 19349 | 15504 | -0.158 | -0.6522 | Yes | ||
| 14 | CHEK2 | 16751 3587 | 15526 | -0.161 | -0.6400 | Yes | ||
| 15 | FANCG | 15904 | 15580 | -0.169 | -0.6288 | Yes | ||
| 16 | BRCA1 | 20213 | 16654 | -0.466 | -0.6478 | Yes | ||
| 17 | MRE11A | 3014 19560 | 17156 | -0.746 | -0.6128 | Yes | ||
| 18 | BRCA2 | 16612 | 17317 | -0.884 | -0.5480 | Yes | ||
| 19 | FANCD2 | 17326 464 | 17518 | -1.013 | -0.4746 | Yes | ||
| 20 | TP53 | 20822 | 18610 | -6.426 | 0.0003 | Yes |