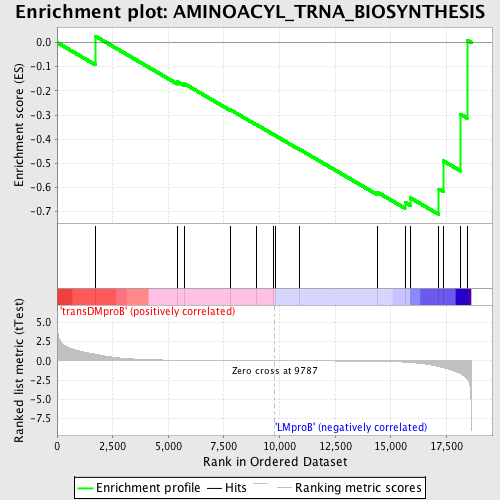
Profile of the Running ES Score & Positions of GeneSet Members on the Rank Ordered List
| Dataset | Set_04_transDMproB_versus_LMproB.phenotype_transDMproB_versus_LMproB.cls #transDMproB_versus_LMproB |
| Phenotype | phenotype_transDMproB_versus_LMproB.cls#transDMproB_versus_LMproB |
| Upregulated in class | LMproB |
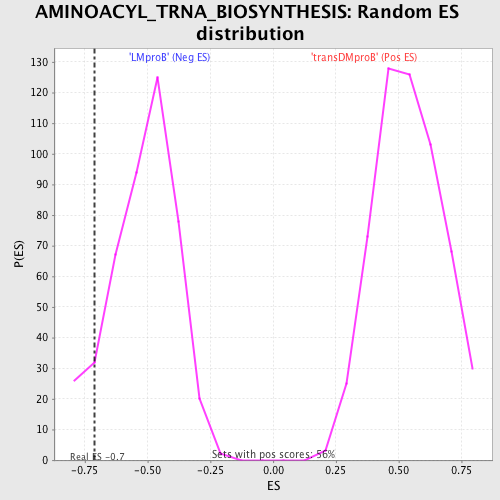
| GeneSet | AMINOACYL_TRNA_BIOSYNTHESIS |
| Enrichment Score (ES) | -0.7114871 |
| Normalized Enrichment Score (NES) | -1.3771437 |
| Nominal p-value | 0.09009009 |
| FDR q-value | 1.0 |
| FWER p-Value | 1.0 |
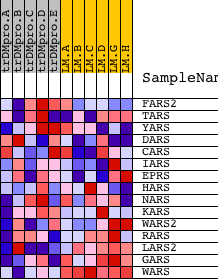
| PROBE | DESCRIPTION (from dataset) | GENE SYMBOL | GENE_TITLE | RANK IN GENE LIST | RANK METRIC SCORE | RUNNING ES | CORE ENRICHMENT | |
|---|---|---|---|---|---|---|---|---|
| 1 | FARS2 | 21666 | 1717 | 0.850 | 0.0264 | No | ||
| 2 | TARS | 22325 8502 | 5404 | 0.071 | -0.1618 | No | ||
| 3 | YARS | 16071 | 5723 | 0.061 | -0.1704 | No | ||
| 4 | DARS | 10375 13846 | 7787 | 0.023 | -0.2781 | No | ||
| 5 | CARS | 1683 17544 | 8941 | 0.009 | -0.3388 | No | ||
| 6 | IARS | 4190 8361 8362 | 9747 | 0.001 | -0.3820 | No | ||
| 7 | EPRS | 14014 | 9821 | -0.000 | -0.3859 | No | ||
| 8 | HARS | 23451 | 10907 | -0.012 | -0.4425 | No | ||
| 9 | NARS | 23418 | 14381 | -0.077 | -0.6185 | No | ||
| 10 | KARS | 18738 | 15638 | -0.179 | -0.6611 | Yes | ||
| 11 | WARS2 | 12884 7688 | 15886 | -0.225 | -0.6429 | Yes | ||
| 12 | RARS | 20496 | 17162 | -0.751 | -0.6067 | Yes | ||
| 13 | LARS2 | 19255 | 17360 | -0.913 | -0.4898 | Yes | ||
| 14 | GARS | 17438 | 18140 | -1.679 | -0.2974 | Yes | ||
| 15 | WARS | 2085 20984 | 18427 | -2.313 | 0.0102 | Yes |