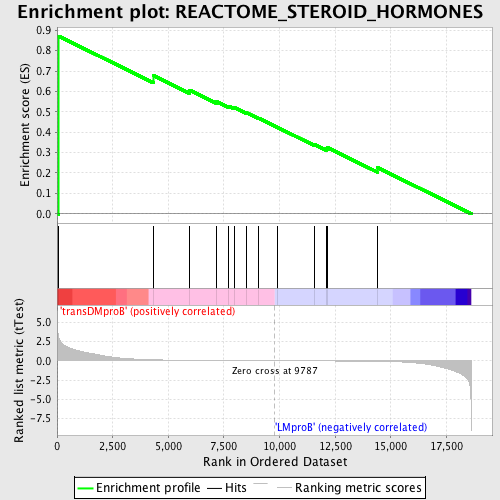
Profile of the Running ES Score & Positions of GeneSet Members on the Rank Ordered List
| Dataset | Set_04_transDMproB_versus_LMproB.phenotype_transDMproB_versus_LMproB.cls #transDMproB_versus_LMproB |
| Phenotype | phenotype_transDMproB_versus_LMproB.cls#transDMproB_versus_LMproB |
| Upregulated in class | transDMproB |
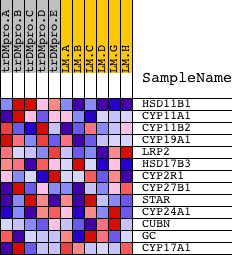
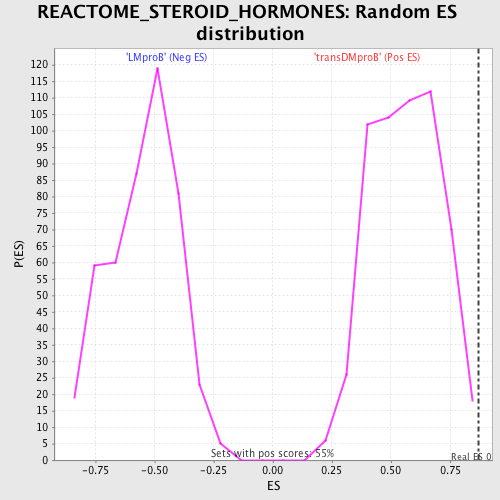
| GeneSet | REACTOME_STEROID_HORMONES |
| Enrichment Score (ES) | 0.871274 |
| Normalized Enrichment Score (NES) | 1.5541352 |
| Nominal p-value | 0.005484461 |
| FDR q-value | 0.41980326 |
| FWER p-Value | 0.92 |
| PROBE | DESCRIPTION (from dataset) | GENE SYMBOL | GENE_TITLE | RANK IN GENE LIST | RANK METRIC SCORE | RUNNING ES | CORE ENRICHMENT | |
|---|---|---|---|---|---|---|---|---|
| 1 | HSD11B1 | 9125 4019 | 67 | 2.980 | 0.8713 | Yes | ||
| 2 | CYP11A1 | 4580 | 4338 | 0.121 | 0.6772 | No | ||
| 3 | CYP11B2 | 24574 | 5960 | 0.055 | 0.6062 | No | ||
| 4 | CYP19A1 | 19112 | 7172 | 0.032 | 0.5505 | No | ||
| 5 | LRP2 | 14566 14567 | 7717 | 0.024 | 0.5282 | No | ||
| 6 | HSD17B3 | 3231 21421 | 7967 | 0.020 | 0.5207 | No | ||
| 7 | CYP2R1 | 17668 | 8498 | 0.014 | 0.4963 | No | ||
| 8 | CYP27B1 | 8831 3426 | 9045 | 0.008 | 0.4693 | No | ||
| 9 | STAR | 5523 | 9927 | -0.002 | 0.4224 | No | ||
| 10 | CYP24A1 | 14328 | 11561 | -0.020 | 0.3404 | No | ||
| 11 | CUBN | 14682 | 12113 | -0.027 | 0.3186 | No | ||
| 12 | GC | 16486 | 12159 | -0.027 | 0.3242 | No | ||
| 13 | CYP17A1 | 23651 | 14405 | -0.078 | 0.2263 | No |