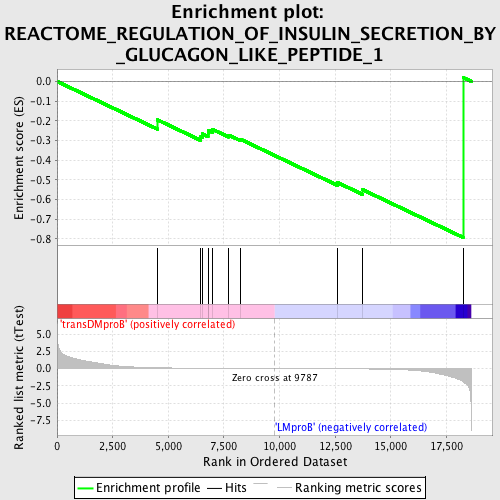
Profile of the Running ES Score & Positions of GeneSet Members on the Rank Ordered List
| Dataset | Set_04_transDMproB_versus_LMproB.phenotype_transDMproB_versus_LMproB.cls #transDMproB_versus_LMproB |
| Phenotype | phenotype_transDMproB_versus_LMproB.cls#transDMproB_versus_LMproB |
| Upregulated in class | LMproB |
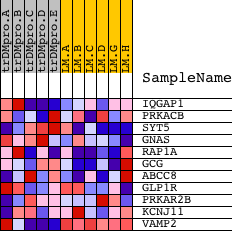
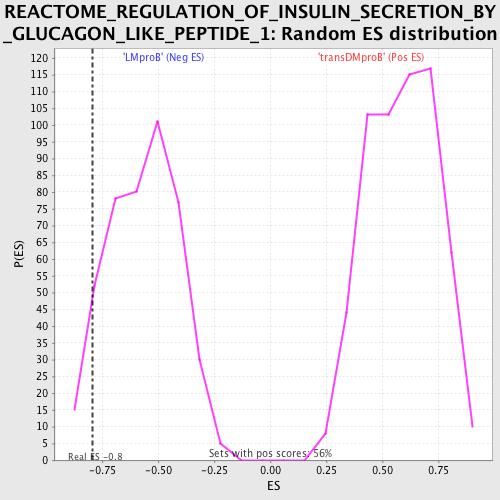
| GeneSet | REACTOME_REGULATION_OF_INSULIN_SECRETION_BY_GLUCAGON_LIKE_PEPTIDE_1 |
| Enrichment Score (ES) | -0.7926444 |
| Normalized Enrichment Score (NES) | -1.3950834 |
| Nominal p-value | 0.07305936 |
| FDR q-value | 1.0 |
| FWER p-Value | 1.0 |
| PROBE | DESCRIPTION (from dataset) | GENE SYMBOL | GENE_TITLE | RANK IN GENE LIST | RANK METRIC SCORE | RUNNING ES | CORE ENRICHMENT | |
|---|---|---|---|---|---|---|---|---|
| 1 | IQGAP1 | 6619 | 4509 | 0.111 | -0.1950 | No | ||
| 2 | PRKACB | 15140 | 6459 | 0.044 | -0.2810 | No | ||
| 3 | SYT5 | 17986 | 6531 | 0.043 | -0.2665 | No | ||
| 4 | GNAS | 9025 2963 2752 | 6786 | 0.038 | -0.2639 | No | ||
| 5 | RAP1A | 8467 | 6798 | 0.038 | -0.2483 | No | ||
| 6 | GCG | 14578 | 6985 | 0.035 | -0.2435 | No | ||
| 7 | ABCC8 | 9941 11649 | 7711 | 0.024 | -0.2723 | No | ||
| 8 | GLP1R | 23304 | 8259 | 0.017 | -0.2946 | No | ||
| 9 | PRKAR2B | 5288 2107 | 12603 | -0.034 | -0.5136 | No | ||
| 10 | KCNJ11 | 17822 | 13734 | -0.057 | -0.5499 | Yes | ||
| 11 | VAMP2 | 20826 | 18251 | -1.897 | 0.0196 | Yes |