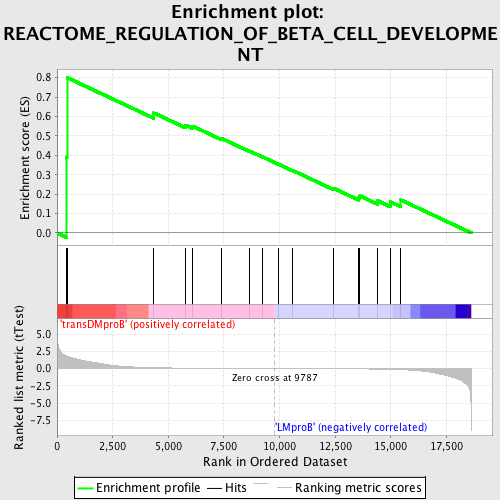
Profile of the Running ES Score & Positions of GeneSet Members on the Rank Ordered List
| Dataset | Set_04_transDMproB_versus_LMproB.phenotype_transDMproB_versus_LMproB.cls #transDMproB_versus_LMproB |
| Phenotype | phenotype_transDMproB_versus_LMproB.cls#transDMproB_versus_LMproB |
| Upregulated in class | transDMproB |
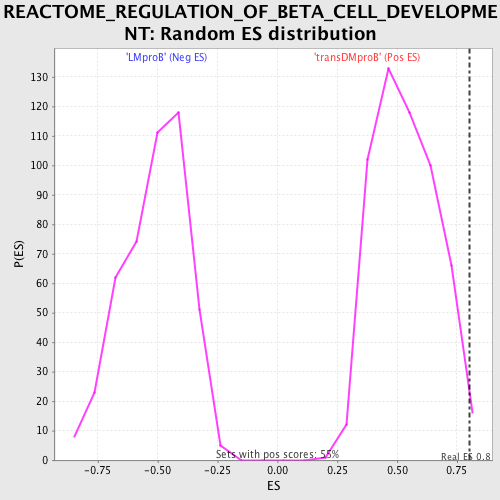
| GeneSet | REACTOME_REGULATION_OF_BETA_CELL_DEVELOPMENT |
| Enrichment Score (ES) | 0.80054533 |
| Normalized Enrichment Score (NES) | 1.494161 |
| Nominal p-value | 0.0054744524 |
| FDR q-value | 0.47458717 |
| FWER p-Value | 0.998 |
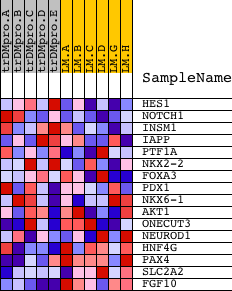
| PROBE | DESCRIPTION (from dataset) | GENE SYMBOL | GENE_TITLE | RANK IN GENE LIST | RANK METRIC SCORE | RUNNING ES | CORE ENRICHMENT | |
|---|---|---|---|---|---|---|---|---|
| 1 | HES1 | 22798 | 430 | 1.809 | 0.3915 | Yes | ||
| 2 | NOTCH1 | 14649 | 445 | 1.788 | 0.8005 | Yes | ||
| 3 | INSM1 | 14815 | 4349 | 0.120 | 0.6182 | No | ||
| 4 | IAPP | 17249 | 5777 | 0.060 | 0.5553 | No | ||
| 5 | PTF1A | 15110 | 6087 | 0.052 | 0.5506 | No | ||
| 6 | NKX2-2 | 5176 | 7393 | 0.028 | 0.4870 | No | ||
| 7 | FOXA3 | 17949 | 8662 | 0.012 | 0.4216 | No | ||
| 8 | PDX1 | 16621 | 9251 | 0.006 | 0.3913 | No | ||
| 9 | NKX6-1 | 16463 | 9949 | -0.002 | 0.3543 | No | ||
| 10 | AKT1 | 8568 | 10562 | -0.008 | 0.3232 | No | ||
| 11 | ONECUT3 | 10896 19942 | 12434 | -0.031 | 0.2298 | No | ||
| 12 | NEUROD1 | 14550 | 13552 | -0.052 | 0.1816 | No | ||
| 13 | HNF4G | 15640 | 13612 | -0.054 | 0.1907 | No | ||
| 14 | PAX4 | 17199 | 14418 | -0.078 | 0.1654 | No | ||
| 15 | SLC2A2 | 15623 1880 1855 | 14983 | -0.109 | 0.1600 | No | ||
| 16 | FGF10 | 4719 8962 | 15453 | -0.154 | 0.1700 | No |