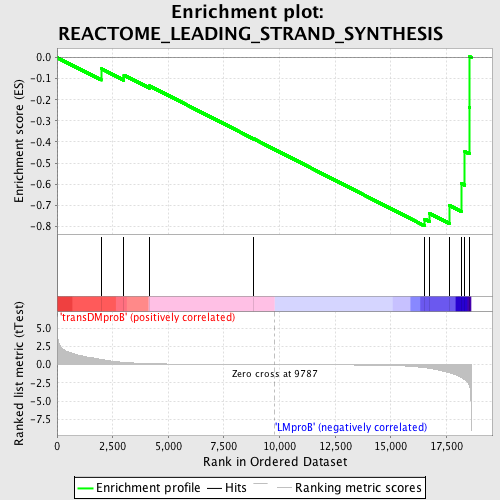
Profile of the Running ES Score & Positions of GeneSet Members on the Rank Ordered List
| Dataset | Set_04_transDMproB_versus_LMproB.phenotype_transDMproB_versus_LMproB.cls #transDMproB_versus_LMproB |
| Phenotype | phenotype_transDMproB_versus_LMproB.cls#transDMproB_versus_LMproB |
| Upregulated in class | LMproB |
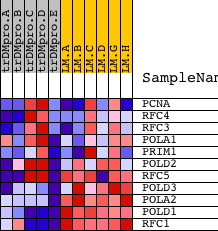
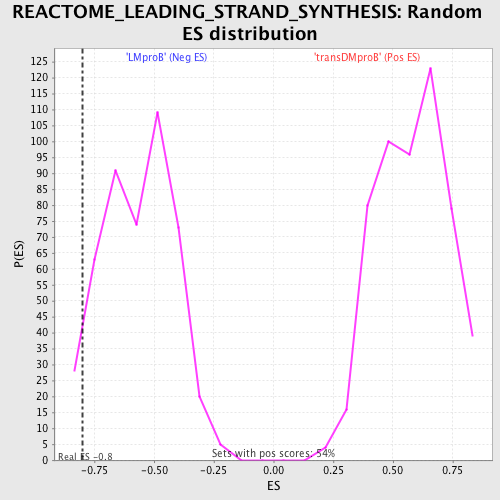
| GeneSet | REACTOME_LEADING_STRAND_SYNTHESIS |
| Enrichment Score (ES) | -0.79839337 |
| Normalized Enrichment Score (NES) | -1.4102055 |
| Nominal p-value | 0.049676027 |
| FDR q-value | 1.0 |
| FWER p-Value | 1.0 |
| PROBE | DESCRIPTION (from dataset) | GENE SYMBOL | GENE_TITLE | RANK IN GENE LIST | RANK METRIC SCORE | RUNNING ES | CORE ENRICHMENT | |
|---|---|---|---|---|---|---|---|---|
| 1 | PCNA | 9535 | 1977 | 0.701 | -0.0520 | No | ||
| 2 | RFC4 | 1735 22627 | 3004 | 0.309 | -0.0831 | No | ||
| 3 | RFC3 | 12786 | 4153 | 0.137 | -0.1342 | No | ||
| 4 | POLA1 | 24112 | 8845 | 0.010 | -0.3856 | No | ||
| 5 | PRIM1 | 19847 | 16527 | -0.414 | -0.7664 | Yes | ||
| 6 | POLD2 | 20537 | 16730 | -0.503 | -0.7383 | Yes | ||
| 7 | RFC5 | 13005 7791 | 17631 | -1.099 | -0.7016 | Yes | ||
| 8 | POLD3 | 17742 | 18165 | -1.717 | -0.5972 | Yes | ||
| 9 | POLA2 | 23988 | 18327 | -2.076 | -0.4451 | Yes | ||
| 10 | POLD1 | 17847 | 18525 | -2.830 | -0.2366 | Yes | ||
| 11 | RFC1 | 16527 | 18551 | -3.119 | 0.0035 | Yes |