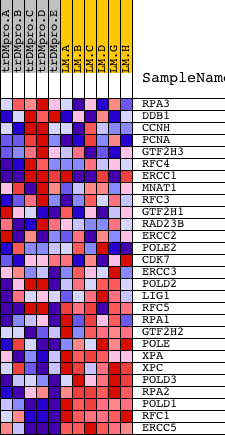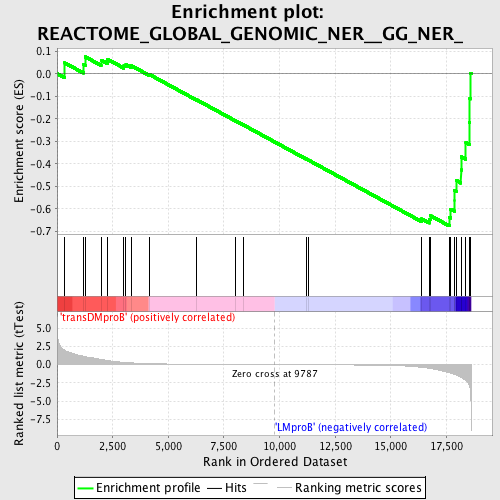
Profile of the Running ES Score & Positions of GeneSet Members on the Rank Ordered List
| Dataset | Set_04_transDMproB_versus_LMproB.phenotype_transDMproB_versus_LMproB.cls #transDMproB_versus_LMproB |
| Phenotype | phenotype_transDMproB_versus_LMproB.cls#transDMproB_versus_LMproB |
| Upregulated in class | LMproB |
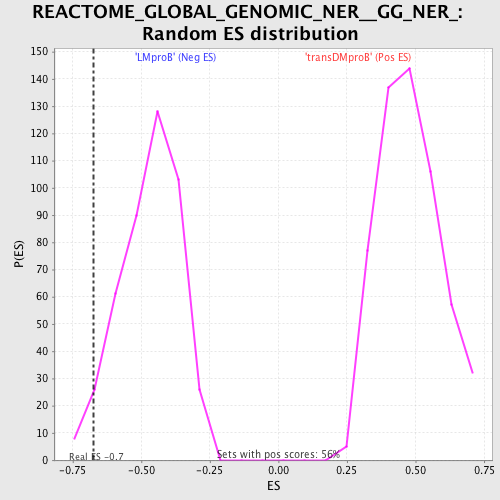
| GeneSet | REACTOME_GLOBAL_GENOMIC_NER__GG_NER_ |
| Enrichment Score (ES) | -0.6760183 |
| Normalized Enrichment Score (NES) | -1.4441404 |
| Nominal p-value | 0.03846154 |
| FDR q-value | 1.0 |
| FWER p-Value | 1.0 |
| PROBE | DESCRIPTION (from dataset) | GENE SYMBOL | GENE_TITLE | RANK IN GENE LIST | RANK METRIC SCORE | RUNNING ES | CORE ENRICHMENT | |
|---|---|---|---|---|---|---|---|---|
| 1 | RPA3 | 12667 | 346 | 1.954 | 0.0483 | No | ||
| 2 | DDB1 | 23931 | 1183 | 1.142 | 0.0425 | No | ||
| 3 | CCNH | 7322 | 1268 | 1.089 | 0.0753 | No | ||
| 4 | PCNA | 9535 | 1977 | 0.701 | 0.0612 | No | ||
| 5 | GTF2H3 | 5551 | 2268 | 0.554 | 0.0646 | No | ||
| 6 | RFC4 | 1735 22627 | 3004 | 0.309 | 0.0356 | No | ||
| 7 | ERCC1 | 1235 1045 1646 | 3093 | 0.287 | 0.0407 | No | ||
| 8 | MNAT1 | 9396 2161 | 3328 | 0.242 | 0.0364 | No | ||
| 9 | RFC3 | 12786 | 4153 | 0.137 | -0.0032 | No | ||
| 10 | GTF2H1 | 4069 18236 | 6279 | 0.047 | -0.1159 | No | ||
| 11 | RAD23B | 5349 | 8038 | 0.019 | -0.2098 | No | ||
| 12 | ERCC2 | 1549 18363 3812 | 8357 | 0.016 | -0.2264 | No | ||
| 13 | POLE2 | 21053 | 11189 | -0.015 | -0.3781 | No | ||
| 14 | CDK7 | 21365 | 11317 | -0.017 | -0.3844 | No | ||
| 15 | ERCC3 | 23605 | 16391 | -0.367 | -0.6447 | No | ||
| 16 | POLD2 | 20537 | 16730 | -0.503 | -0.6457 | Yes | ||
| 17 | LIG1 | 18388 1749 1493 | 16778 | -0.526 | -0.6302 | Yes | ||
| 18 | RFC5 | 13005 7791 | 17631 | -1.099 | -0.6384 | Yes | ||
| 19 | RPA1 | 20349 | 17680 | -1.170 | -0.6008 | Yes | ||
| 20 | GTF2H2 | 6236 | 17860 | -1.337 | -0.5647 | Yes | ||
| 21 | POLE | 16755 | 17862 | -1.338 | -0.5188 | Yes | ||
| 22 | XPA | 5924 | 17941 | -1.432 | -0.4740 | Yes | ||
| 23 | XPC | 5925 | 18154 | -1.700 | -0.4271 | Yes | ||
| 24 | POLD3 | 17742 | 18165 | -1.717 | -0.3688 | Yes | ||
| 25 | RPA2 | 2330 16057 | 18374 | -2.174 | -0.3055 | Yes | ||
| 26 | POLD1 | 17847 | 18525 | -2.830 | -0.2166 | Yes | ||
| 27 | RFC1 | 16527 | 18551 | -3.119 | -0.1111 | Yes | ||
| 28 | ERCC5 | 14255 4097 | 18568 | -3.343 | 0.0026 | Yes |