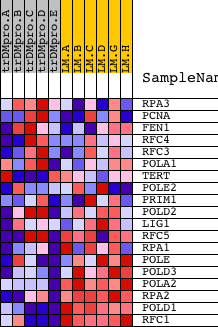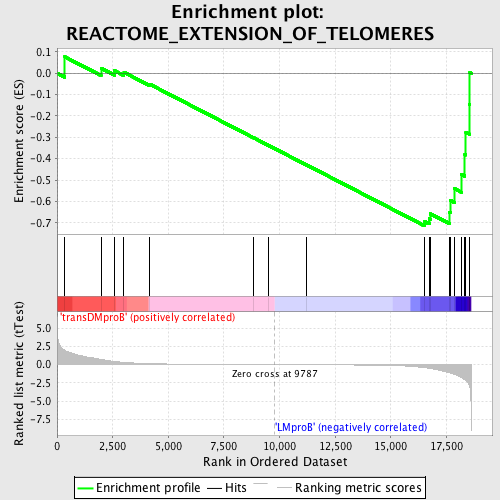
Profile of the Running ES Score & Positions of GeneSet Members on the Rank Ordered List
| Dataset | Set_04_transDMproB_versus_LMproB.phenotype_transDMproB_versus_LMproB.cls #transDMproB_versus_LMproB |
| Phenotype | phenotype_transDMproB_versus_LMproB.cls#transDMproB_versus_LMproB |
| Upregulated in class | LMproB |
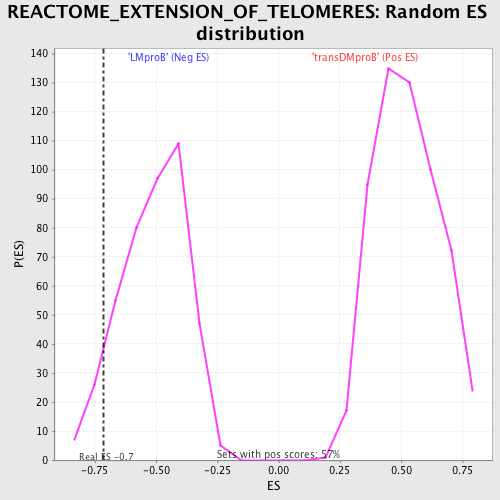
| GeneSet | REACTOME_EXTENSION_OF_TELOMERES |
| Enrichment Score (ES) | -0.7146428 |
| Normalized Enrichment Score (NES) | -1.4027749 |
| Nominal p-value | 0.07042254 |
| FDR q-value | 1.0 |
| FWER p-Value | 1.0 |
| PROBE | DESCRIPTION (from dataset) | GENE SYMBOL | GENE_TITLE | RANK IN GENE LIST | RANK METRIC SCORE | RUNNING ES | CORE ENRICHMENT | |
|---|---|---|---|---|---|---|---|---|
| 1 | RPA3 | 12667 | 346 | 1.954 | 0.0766 | No | ||
| 2 | PCNA | 9535 | 1977 | 0.701 | 0.0231 | No | ||
| 3 | FEN1 | 8961 | 2585 | 0.433 | 0.0115 | No | ||
| 4 | RFC4 | 1735 22627 | 3004 | 0.309 | 0.0041 | No | ||
| 5 | RFC3 | 12786 | 4153 | 0.137 | -0.0509 | No | ||
| 6 | POLA1 | 24112 | 8845 | 0.010 | -0.3027 | No | ||
| 7 | TERT | 21604 | 9488 | 0.003 | -0.3370 | No | ||
| 8 | POLE2 | 21053 | 11189 | -0.015 | -0.4277 | No | ||
| 9 | PRIM1 | 19847 | 16527 | -0.414 | -0.6945 | Yes | ||
| 10 | POLD2 | 20537 | 16730 | -0.503 | -0.6808 | Yes | ||
| 11 | LIG1 | 18388 1749 1493 | 16778 | -0.526 | -0.6578 | Yes | ||
| 12 | RFC5 | 13005 7791 | 17631 | -1.099 | -0.6500 | Yes | ||
| 13 | RPA1 | 20349 | 17680 | -1.170 | -0.5956 | Yes | ||
| 14 | POLE | 16755 | 17862 | -1.338 | -0.5402 | Yes | ||
| 15 | POLD3 | 17742 | 18165 | -1.717 | -0.4728 | Yes | ||
| 16 | POLA2 | 23988 | 18327 | -2.076 | -0.3803 | Yes | ||
| 17 | RPA2 | 2330 16057 | 18374 | -2.174 | -0.2769 | Yes | ||
| 18 | POLD1 | 17847 | 18525 | -2.830 | -0.1471 | Yes | ||
| 19 | RFC1 | 16527 | 18551 | -3.119 | 0.0035 | Yes |