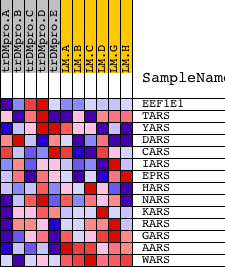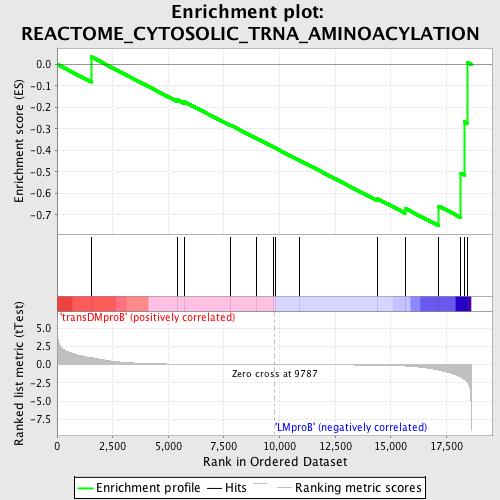
Profile of the Running ES Score & Positions of GeneSet Members on the Rank Ordered List
| Dataset | Set_04_transDMproB_versus_LMproB.phenotype_transDMproB_versus_LMproB.cls #transDMproB_versus_LMproB |
| Phenotype | phenotype_transDMproB_versus_LMproB.cls#transDMproB_versus_LMproB |
| Upregulated in class | LMproB |
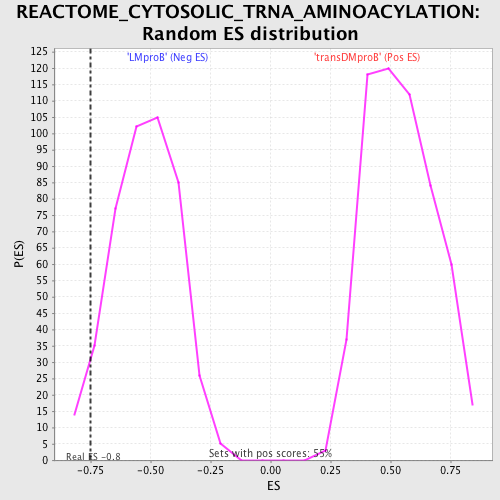
| GeneSet | REACTOME_CYTOSOLIC_TRNA_AMINOACYLATION |
| Enrichment Score (ES) | -0.7517706 |
| Normalized Enrichment Score (NES) | -1.4332314 |
| Nominal p-value | 0.053452116 |
| FDR q-value | 1.0 |
| FWER p-Value | 1.0 |
| PROBE | DESCRIPTION (from dataset) | GENE SYMBOL | GENE_TITLE | RANK IN GENE LIST | RANK METRIC SCORE | RUNNING ES | CORE ENRICHMENT | |
|---|---|---|---|---|---|---|---|---|
| 1 | EEF1E1 | 21488 | 1533 | 0.955 | 0.0347 | No | ||
| 2 | TARS | 22325 8502 | 5404 | 0.071 | -0.1646 | No | ||
| 3 | YARS | 16071 | 5723 | 0.061 | -0.1741 | No | ||
| 4 | DARS | 10375 13846 | 7787 | 0.023 | -0.2823 | No | ||
| 5 | CARS | 1683 17544 | 8941 | 0.009 | -0.3431 | No | ||
| 6 | IARS | 4190 8361 8362 | 9747 | 0.001 | -0.3863 | No | ||
| 7 | EPRS | 14014 | 9821 | -0.000 | -0.3902 | No | ||
| 8 | HARS | 23451 | 10907 | -0.012 | -0.4471 | No | ||
| 9 | NARS | 23418 | 14381 | -0.077 | -0.6243 | No | ||
| 10 | KARS | 18738 | 15638 | -0.179 | -0.6699 | Yes | ||
| 11 | RARS | 20496 | 17162 | -0.751 | -0.6597 | Yes | ||
| 12 | GARS | 17438 | 18140 | -1.679 | -0.5063 | Yes | ||
| 13 | AARS | 10630 6151 | 18311 | -2.023 | -0.2674 | Yes | ||
| 14 | WARS | 2085 20984 | 18427 | -2.313 | 0.0102 | Yes |