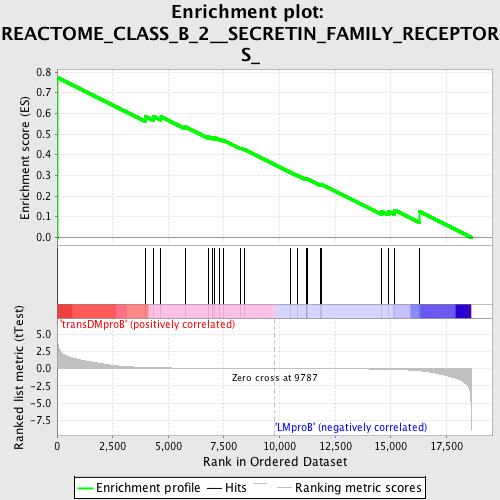
Profile of the Running ES Score & Positions of GeneSet Members on the Rank Ordered List
| Dataset | Set_04_transDMproB_versus_LMproB.phenotype_transDMproB_versus_LMproB.cls #transDMproB_versus_LMproB |
| Phenotype | phenotype_transDMproB_versus_LMproB.cls#transDMproB_versus_LMproB |
| Upregulated in class | transDMproB |
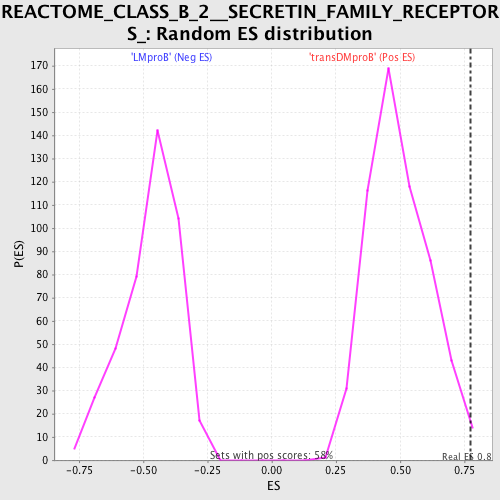
| GeneSet | REACTOME_CLASS_B_2__SECRETIN_FAMILY_RECEPTORS_ |
| Enrichment Score (ES) | 0.77312344 |
| Normalized Enrichment Score (NES) | 1.5665722 |
| Nominal p-value | 0.0069204154 |
| FDR q-value | 0.6799831 |
| FWER p-Value | 0.861 |
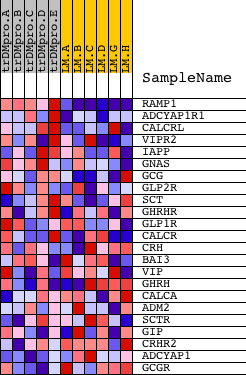
| PROBE | DESCRIPTION (from dataset) | GENE SYMBOL | GENE_TITLE | RANK IN GENE LIST | RANK METRIC SCORE | RUNNING ES | CORE ENRICHMENT | |
|---|---|---|---|---|---|---|---|---|
| 1 | RAMP1 | 14189 | 9 | 4.752 | 0.7731 | Yes | ||
| 2 | ADCYAP1R1 | 8553 1192 4349 | 3959 | 0.155 | 0.5860 | No | ||
| 3 | CALCRL | 12041 | 4327 | 0.121 | 0.5861 | No | ||
| 4 | VIPR2 | 21125 | 4668 | 0.102 | 0.5844 | No | ||
| 5 | IAPP | 17249 | 5777 | 0.060 | 0.5346 | No | ||
| 6 | GNAS | 9025 2963 2752 | 6786 | 0.038 | 0.4866 | No | ||
| 7 | GCG | 14578 | 6985 | 0.035 | 0.4816 | No | ||
| 8 | GLP2R | 8227 13563 13564 | 7095 | 0.033 | 0.4811 | No | ||
| 9 | SCT | 17560 | 7292 | 0.030 | 0.4754 | No | ||
| 10 | GHRHR | 1007 17436 | 7492 | 0.027 | 0.4690 | No | ||
| 11 | GLP1R | 23304 | 8259 | 0.017 | 0.4306 | No | ||
| 12 | CALCR | 17229 | 8403 | 0.015 | 0.4253 | No | ||
| 13 | CRH | 8784 | 10493 | -0.008 | 0.3142 | No | ||
| 14 | BAI3 | 5580 | 10797 | -0.011 | 0.2997 | No | ||
| 15 | VIP | 20096 | 11191 | -0.015 | 0.2810 | No | ||
| 16 | GHRH | 14372 | 11205 | -0.015 | 0.2828 | No | ||
| 17 | CALCA | 4470 | 11258 | -0.016 | 0.2826 | No | ||
| 18 | ADM2 | 22388 | 11822 | -0.023 | 0.2561 | No | ||
| 19 | SCTR | 14157 | 11894 | -0.024 | 0.2562 | No | ||
| 20 | GIP | 76 | 14589 | -0.085 | 0.1252 | No | ||
| 21 | CRHR2 | 17140 | 14894 | -0.102 | 0.1255 | No | ||
| 22 | ADCYAP1 | 4348 | 15180 | -0.125 | 0.1306 | No | ||
| 23 | GCGR | 20566 | 16299 | -0.333 | 0.1246 | No |