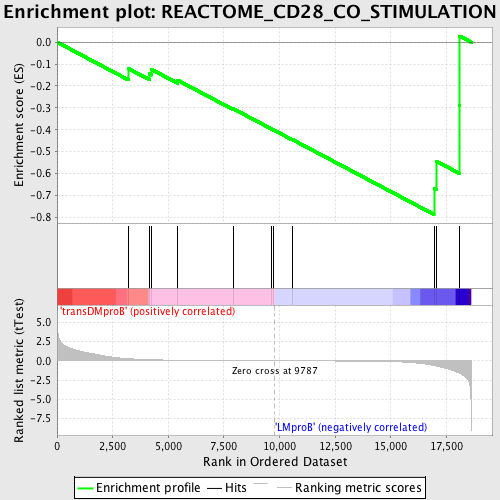
Profile of the Running ES Score & Positions of GeneSet Members on the Rank Ordered List
| Dataset | Set_04_transDMproB_versus_LMproB.phenotype_transDMproB_versus_LMproB.cls #transDMproB_versus_LMproB |
| Phenotype | phenotype_transDMproB_versus_LMproB.cls#transDMproB_versus_LMproB |
| Upregulated in class | LMproB |
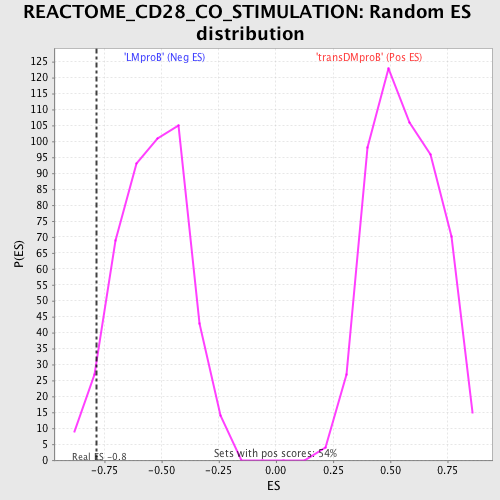
| GeneSet | REACTOME_CD28_CO_STIMULATION |
| Enrichment Score (ES) | -0.78663427 |
| Normalized Enrichment Score (NES) | -1.4536731 |
| Nominal p-value | 0.04338395 |
| FDR q-value | 1.0 |
| FWER p-Value | 1.0 |
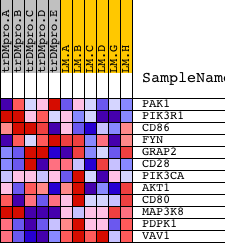
| PROBE | DESCRIPTION (from dataset) | GENE SYMBOL | GENE_TITLE | RANK IN GENE LIST | RANK METRIC SCORE | RUNNING ES | CORE ENRICHMENT | |
|---|---|---|---|---|---|---|---|---|
| 1 | PAK1 | 9527 | 3203 | 0.265 | -0.1204 | No | ||
| 2 | PIK3R1 | 3170 | 4146 | 0.138 | -0.1441 | No | ||
| 3 | CD86 | 1660 22601 | 4254 | 0.127 | -0.1250 | No | ||
| 4 | FYN | 3375 3395 20052 | 5417 | 0.071 | -0.1736 | No | ||
| 5 | GRAP2 | 5113 9398 | 7924 | 0.021 | -0.3043 | No | ||
| 6 | CD28 | 14239 4092 | 9636 | 0.002 | -0.3959 | No | ||
| 7 | PIK3CA | 9562 | 9725 | 0.001 | -0.4005 | No | ||
| 8 | AKT1 | 8568 | 10562 | -0.008 | -0.4438 | No | ||
| 9 | CD80 | 22758 | 16942 | -0.606 | -0.6682 | Yes | ||
| 10 | MAP3K8 | 23495 | 17035 | -0.667 | -0.5429 | Yes | ||
| 11 | PDPK1 | 23097 | 18075 | -1.593 | -0.2875 | Yes | ||
| 12 | VAV1 | 23173 | 18100 | -1.620 | 0.0277 | Yes |